c5a.xlarge by Amazon Web Services
Geekbench is a cross-platform processor benchmark with a scoring system that determines single-core and multi-core performance using loads simulating real-world scenarios. Geekbench 5 score is calculated with a reference score of 2500 representing the performance of the Intel Core i5-2520M @ 2.50 GHz. The software benchmark is available for Mac OS, Windows, Linux, Android and iOS platforms.
Specifications:
CPU
4
RAM
8.0 GB
Net
10000 Mbps
{
"configuration": {
"chart": {
"type": "scatter",
"polar": false,
"zoomType": "",
"options3d": {},
"height": null,
"width": null,
"margin": null,
"inverted": false,
"zooming": {}
},
"credits": {
"enabled": false
},
"title": {
"text": ""
},
"colorAxis": null,
"subtitle": {
"text": ""
},
"xAxis": {
"title": {
"text": [
"Single Score"
],
"useHTML": false,
"style": {
"color": "#666666"
}
},
"categories": null,
"lineWidth": 1,
"tickInterval": null,
"tickWidth": 1,
"tickLength": 10,
"tickPixelInterval": 100,
"plotLines": null,
"labels": {
"enabled": true,
"format": null,
"formatter": "",
"style": {
"color": "#666666",
"cursor": "default",
"fontSize": "11px"
},
"useHTML": false,
"step": 0
},
"plotBands": null,
"visible": true,
"floor": null,
"ceiling": null,
"type": "linear",
"min": 0,
"gridLineWidth": 1,
"gridLineColor": "#e6e6e6",
"minorTickInterval": null,
"minorTickWidth": 0,
"minTickInterval": null,
"startOnTick": true,
"endOnTick": true,
"tickmarkPlacement": 100,
"units": 100,
"minRange": 100
},
"yAxis": {
"title": {
"text": [
"Multi Score"
],
"useHTML": false,
"style": {
"color": "#666666"
}
},
"categories": null,
"plotLines": null,
"plotBands": null,
"lineWidth": null,
"tickInterval": null,
"tickLength": 10,
"floor": null,
"ceiling": null,
"gridLineInterpolation": null,
"gridLineWidth": 1,
"gridLineColor": "#e6e6e6",
"min": 0,
"max": null,
"minorTickInterval": null,
"minorTickWidth": 0,
"minTickInterval": null,
"startOnTick": true,
"endOnTick": true,
"minRange": null,
"type": "linear",
"tickmarkPlacement": null,
"labels": {
"enabled": true,
"formatter": null,
"style": {
"color": "#666666",
"cursor": "default",
"fontSize": "11px"
},
"useHTML": false
}
},
"zAxis": {
"title": {
"text": "Multi Score"
}
},
"plotOptions": {
"series": {
"dataLabels": {
"enabled": false,
"format": null,
"distance": 30,
"align": "center",
"inside": null,
"allowOverlap": false,
"style": {
"fontSize": "11px"
}
},
"showInLegend": null,
"turboThreshold": 0,
"stacking": "",
"groupPadding": 0.2,
"centerInCategory": false,
"findNearestPointBy": "x"
}
},
"navigator": {
"enabled": false
},
"scrollbar": {
"enabled": false
},
"rangeSelector": {
"enabled": false,
"inputEnabled": false
},
"legend": {
"enabled": null,
"maxHeight": null,
"align": "center",
"verticalAlign": "bottom",
"layout": "horizontal",
"width": null,
"margin": 12,
"reversed": false
},
"series": [
{
"name": "c5a.xlarge by Amazon Web Services",
"color": "#f7981d",
"data": [
{
"x": 719.2507802849661,
"y": 1713.7390086100559
},
{
"x": 696.1025531452774,
"y": 1660.182575770601
},
{
"x": 714.989347295603,
"y": 1708.7641299634697
},
{
"x": 685.3613465512833,
"y": 1665.1266260914776
},
{
"x": 716.0334104846117,
"y": 1718.0402548507984
},
{
"x": 686.8308452174892,
"y": 1665.618006408383
},
{
"x": 706.1396534037009,
"y": 1710.8730936968257
},
{
"x": 682.4118657357845,
"y": 1657.8700736509668
},
{
"x": 715.7289507412775,
"y": 1708.9622604853255
},
{
"x": 684.4444648454178,
"y": 1660.4982863351988
},
{
"x": 953.7026129057672,
"y": 2362.3971863049824
},
{
"x": 919.9582348271667,
"y": 2292.845961655019
},
{
"x": 956.2705652667121,
"y": 2363.642578501571
},
{
"x": 915.7347231480563,
"y": 2292.342729378631
},
{
"x": 953.6406718745698,
"y": 2366.4316268744656
},
{
"x": 921.5340199406687,
"y": 2299.8403082755917
},
{
"x": 953.8932150244996,
"y": 2361.0292905273536
},
{
"x": 913.9255704032907,
"y": 2297.079541250116
},
{
"x": 954.13585110294,
"y": 2359.3519799945834
},
{
"x": 916.3908566127398,
"y": 2291.8341692545637
},
{
"x": 950.4246722518443,
"y": 2327.335560905084
},
{
"x": 942.4320548804684,
"y": 2330.112447843209
},
{
"x": 956.2117820974026,
"y": 2338.444754274421
},
{
"x": 948.2083665896955,
"y": 2325.868065009752
},
{
"x": 947.7372173241711,
"y": 2325.9524391792525
},
{
"x": 945.6369589566028,
"y": 2324.705159612132
},
{
"x": 945.0150421907563,
"y": 2318.536425491452
},
{
"x": 951.0026725742945,
"y": 2327.068446891166
},
{
"x": 946.3197811590771,
"y": 2315.986809434118
},
{
"x": 947.5166222530353,
"y": 2329.921144432097
},
{
"x": 982.7645409399902,
"y": 2389.6692760301485
},
{
"x": 968.5528226973136,
"y": 2384.705687761974
},
{
"x": 982.6876052867754,
"y": 2399.792089451296
},
{
"x": 985.7205167230801,
"y": 2412.601369905525
},
{
"x": 982.4125240787121,
"y": 2387.336230618776
},
{
"x": 988.1575759399373,
"y": 2408.0277978829363
},
{
"x": 981.4979362821322,
"y": 2389.409844266082
},
{
"x": 984.3095440328127,
"y": 2406.1119619552273
},
{
"x": 980.3318503582918,
"y": 2394.2776718258283
},
{
"x": 985.9263182914333,
"y": 2411.3213486386576
},
{
"x": 990.0401137533433,
"y": 2403.9710586598712
},
{
"x": 980.8337869955152,
"y": 2384.6200836428725
},
{
"x": 986.4724464302485,
"y": 2409.98163751937
},
{
"x": 983.1845166148105,
"y": 2390.219126410112
},
{
"x": 985.5288514655151,
"y": 2409.4043121364084
},
{
"x": 979.324996968033,
"y": 2388.02296654824
},
{
"x": 984.6109615750902,
"y": 2402.203053878466
},
{
"x": 980.1598479646373,
"y": 2392.119936368415
},
{
"x": 988.5695858320335,
"y": 2401.992042366854
},
{
"x": 984.8865541886245,
"y": 2390.975158713953
}
]
}
],
"drilldown": {},
"tooltip": {
"enabled": true,
"useHTML": false,
"format": null,
"headerFormat": "",
"pointFormat": "<span style=\"color:{series.color}\">Single</span>: <b>{point.x:.0f}</b><br><span style=\"color:{series.color}\">Multi</span>: <b>{point.y:.0f}</b>",
"footerFormat": "",
"shared": false,
"outside": false,
"valueDecimals": null,
"split": false
},
"annotations": null
},
"hc_type": "chart",
"id": "191023209520318840252815302094801821525"
}
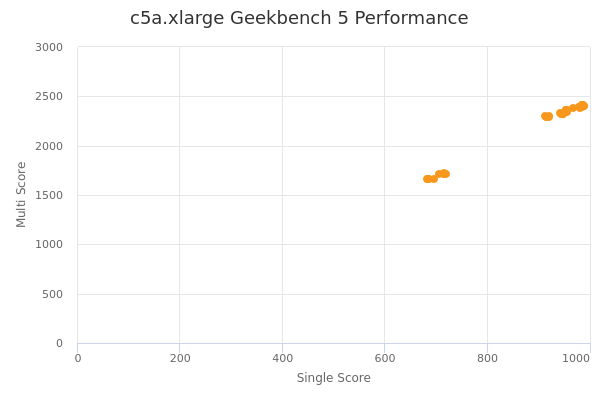
| Single | Multi | |
|---|---|---|
| Max | 990 | 2413 |
| Average | 910 | 2228 |
| Deviation | 107.02 | 272.85 |
| Min | 682 | 1658 |
Sign up as Freemium to get more insight.
- In same series
- c5a.large
- c5a.xlarge
- c5a.2xlarge
- c5a.4xlarge
- c5a.8xlarge
- c5a.12xlarge
- c5a.16xlarge
- c5a.24xlarge