c5a.large by Amazon Web Services
Geekbench is a cross-platform processor benchmark with a scoring system that determines single-core and multi-core performance using loads simulating real-world scenarios. Geekbench 5 score is calculated with a reference score of 2500 representing the performance of the Intel Core i5-2520M @ 2.50 GHz. The software benchmark is available for Mac OS, Windows, Linux, Android and iOS platforms.
Specifications:
CPU
2
RAM
4.0 GB
Net
10000 Mbps
{
"configuration": {
"chart": {
"type": "scatter",
"polar": false,
"zoomType": "",
"options3d": {},
"height": null,
"width": null,
"margin": null,
"inverted": false,
"zooming": {}
},
"credits": {
"enabled": false
},
"title": {
"text": ""
},
"colorAxis": null,
"subtitle": {
"text": ""
},
"xAxis": {
"title": {
"text": [
"Single Score"
],
"useHTML": false,
"style": {
"color": "#666666"
}
},
"categories": null,
"lineWidth": 1,
"tickInterval": null,
"tickWidth": 1,
"tickLength": 10,
"tickPixelInterval": 100,
"plotLines": null,
"labels": {
"enabled": true,
"format": null,
"formatter": "",
"style": {
"color": "#666666",
"cursor": "default",
"fontSize": "11px"
},
"useHTML": false,
"step": 0
},
"plotBands": null,
"visible": true,
"floor": null,
"ceiling": null,
"type": "linear",
"min": 0,
"gridLineWidth": 1,
"gridLineColor": "#e6e6e6",
"minorTickInterval": null,
"minorTickWidth": 0,
"minTickInterval": null,
"startOnTick": true,
"endOnTick": true,
"tickmarkPlacement": 100,
"units": 100,
"minRange": 100
},
"yAxis": {
"title": {
"text": [
"Multi Score"
],
"useHTML": false,
"style": {
"color": "#666666"
}
},
"categories": null,
"plotLines": null,
"plotBands": null,
"lineWidth": null,
"tickInterval": null,
"tickLength": 10,
"floor": null,
"ceiling": null,
"gridLineInterpolation": null,
"gridLineWidth": 1,
"gridLineColor": "#e6e6e6",
"min": 0,
"max": null,
"minorTickInterval": null,
"minorTickWidth": 0,
"minTickInterval": null,
"startOnTick": true,
"endOnTick": true,
"minRange": null,
"type": "linear",
"tickmarkPlacement": null,
"labels": {
"enabled": true,
"formatter": null,
"style": {
"color": "#666666",
"cursor": "default",
"fontSize": "11px"
},
"useHTML": false
}
},
"zAxis": {
"title": {
"text": "Multi Score"
}
},
"plotOptions": {
"series": {
"dataLabels": {
"enabled": false,
"format": null,
"distance": 30,
"align": "center",
"inside": null,
"allowOverlap": false,
"style": {
"fontSize": "11px"
}
},
"showInLegend": null,
"turboThreshold": 0,
"stacking": "",
"groupPadding": 0.2,
"centerInCategory": false,
"findNearestPointBy": "x"
}
},
"navigator": {
"enabled": false
},
"scrollbar": {
"enabled": false
},
"rangeSelector": {
"enabled": false,
"inputEnabled": false
},
"legend": {
"enabled": null,
"maxHeight": null,
"align": "center",
"verticalAlign": "bottom",
"layout": "horizontal",
"width": null,
"margin": 12,
"reversed": false
},
"series": [
{
"name": "c5a.large by Amazon Web Services",
"color": "#f7981d",
"data": [
{
"x": 921.5206856374052,
"y": 1199.352553842423
},
{
"x": 917.5623498853433,
"y": 1163.9494360254498
},
{
"x": 908.8521910368795,
"y": 1153.6068726438323
},
{
"x": 906.2461334035148,
"y": 1159.7591110345315
},
{
"x": 915.956843842713,
"y": 1203.4462838314075
},
{
"x": 923.498110102059,
"y": 1164.2213966251625
},
{
"x": 902.0978224671435,
"y": 1156.6900966886853
},
{
"x": 904.5524104965939,
"y": 1156.8893631341818
},
{
"x": 913.5187999571178,
"y": 1200.4208056894568
},
{
"x": 916.9754474176623,
"y": 1163.0038743408968
},
{
"x": 902.9963535393986,
"y": 1155.7566294462374
},
{
"x": 903.33778506583,
"y": 1154.1952245517118
},
{
"x": 909.5903369096354,
"y": 1199.1731404066709
},
{
"x": 919.8946913204975,
"y": 1165.7723371716415
},
{
"x": 898.5887929480627,
"y": 1147.8972309627807
},
{
"x": 903.7893618012768,
"y": 1151.970296939761
},
{
"x": 912.9455378219741,
"y": 1160.1890450247736
},
{
"x": 912.113933336967,
"y": 1201.784881187521
},
{
"x": 900.2450167128521,
"y": 1155.0783133680125
},
{
"x": 900.7223639911929,
"y": 1156.8709017807678
},
{
"x": 945.2239230760665,
"y": 1208.2848993734945
},
{
"x": 929.0960284189058,
"y": 1185.6486397050603
},
{
"x": 949.6989715579266,
"y": 1206.5935467073723
},
{
"x": 932.186252867939,
"y": 1189.4950384636122
},
{
"x": 929.8930056411155,
"y": 1188.252683710274
},
{
"x": 948.7964418006783,
"y": 1206.8683423019181
},
{
"x": 951.2462844165996,
"y": 1211.3105714065584
},
{
"x": 929.14595710138,
"y": 1183.766474368198
},
{
"x": 947.555442962086,
"y": 1206.2764847710464
},
{
"x": 927.1159362859614,
"y": 1179.5879426505799
},
{
"x": 955.264047484786,
"y": 1228.5980949311806
},
{
"x": 953.7579300927987,
"y": 1220.5097563583367
},
{
"x": 964.2244436994326,
"y": 1226.4879432088696
},
{
"x": 952.362390445958,
"y": 1217.9948551380369
},
{
"x": 955.4275652152412,
"y": 1218.7507959226875
},
{
"x": 952.9090588655001,
"y": 1214.5069482473305
},
{
"x": 958.5948188828493,
"y": 1221.5766824473185
},
{
"x": 952.4550977897313,
"y": 1216.1611861031586
},
{
"x": 960.609659055644,
"y": 1223.138610683272
},
{
"x": 953.7091553235786,
"y": 1218.7173267488702
},
{
"x": 957.9326647345101,
"y": 1220.5366668181096
},
{
"x": 955.295456171084,
"y": 1215.6778193023188
},
{
"x": 960.8391271785972,
"y": 1216.923362068599
},
{
"x": 953.4275335772429,
"y": 1221.3529133413774
},
{
"x": 956.3209685743868,
"y": 1224.808350318394
},
{
"x": 951.5335057692323,
"y": 1216.1088341116038
},
{
"x": 957.7234527532567,
"y": 1221.4115365650127
},
{
"x": 953.4290158025246,
"y": 1217.8720705407632
},
{
"x": 959.3419992865449,
"y": 1225.0307529378802
},
{
"x": 951.883667323346,
"y": 1221.6565562145515
}
]
}
],
"drilldown": {},
"tooltip": {
"enabled": true,
"useHTML": false,
"format": null,
"headerFormat": "",
"pointFormat": "<span style=\"color:{series.color}\">Single</span>: <b>{point.x:.0f}</b><br><span style=\"color:{series.color}\">Multi</span>: <b>{point.y:.0f}</b>",
"footerFormat": "",
"shared": false,
"outside": false,
"valueDecimals": null,
"split": false
},
"annotations": null
},
"hc_type": "chart",
"id": "284446705900534034586518912464522888736"
}
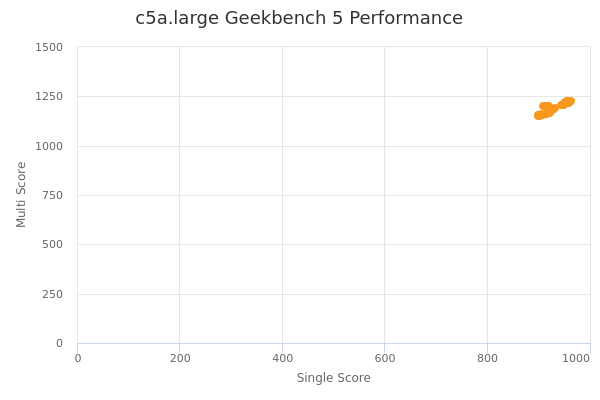
| Single | Multi | |
|---|---|---|
| Max | 964 | 1229 |
| Average | 934 | 1195 |
| Deviation | 21.85 | 26.81 |
| Min | 899 | 1148 |
Sign up as Freemium to get more insight.
- In same series
- c5a.large
- c5a.xlarge
- c5a.2xlarge
- c5a.4xlarge
- c5a.8xlarge
- c5a.12xlarge
- c5a.16xlarge
- c5a.24xlarge