c5a.12xlarge by Amazon Web Services
Geekbench is a cross-platform processor benchmark with a scoring system that determines single-core and multi-core performance using loads simulating real-world scenarios. Geekbench 5 score is calculated with a reference score of 2500 representing the performance of the Intel Core i5-2520M @ 2.50 GHz. The software benchmark is available for Mac OS, Windows, Linux, Android and iOS platforms.
Specifications:
CPU
48
RAM
96.0 GB
Net
12000 Mbps
{
"configuration": {
"chart": {
"type": "scatter",
"polar": false,
"zoomType": "",
"options3d": {},
"height": null,
"width": null,
"margin": null,
"inverted": false,
"zooming": {}
},
"credits": {
"enabled": false
},
"title": {
"text": ""
},
"colorAxis": null,
"subtitle": {
"text": ""
},
"xAxis": {
"title": {
"text": [
"Single Score"
],
"useHTML": false,
"style": {
"color": "#666666"
}
},
"categories": null,
"lineWidth": 1,
"tickInterval": null,
"tickWidth": 1,
"tickLength": 10,
"tickPixelInterval": 100,
"plotLines": null,
"labels": {
"enabled": true,
"format": null,
"formatter": "",
"style": {
"color": "#666666",
"cursor": "default",
"fontSize": "11px"
},
"useHTML": false,
"step": 0
},
"plotBands": null,
"visible": true,
"floor": null,
"ceiling": null,
"type": "linear",
"min": 0,
"gridLineWidth": 1,
"gridLineColor": "#e6e6e6",
"minorTickInterval": null,
"minorTickWidth": 0,
"minTickInterval": null,
"startOnTick": true,
"endOnTick": true,
"tickmarkPlacement": 100,
"units": 100,
"minRange": 100
},
"yAxis": {
"title": {
"text": [
"Multi Score"
],
"useHTML": false,
"style": {
"color": "#666666"
}
},
"categories": null,
"plotLines": null,
"plotBands": null,
"lineWidth": null,
"tickInterval": null,
"tickLength": 10,
"floor": null,
"ceiling": null,
"gridLineInterpolation": null,
"gridLineWidth": 1,
"gridLineColor": "#e6e6e6",
"min": 0,
"max": null,
"minorTickInterval": null,
"minorTickWidth": 0,
"minTickInterval": null,
"startOnTick": true,
"endOnTick": true,
"minRange": null,
"type": "linear",
"tickmarkPlacement": null,
"labels": {
"enabled": true,
"formatter": null,
"style": {
"color": "#666666",
"cursor": "default",
"fontSize": "11px"
},
"useHTML": false
}
},
"zAxis": {
"title": {
"text": "Multi Score"
}
},
"plotOptions": {
"series": {
"dataLabels": {
"enabled": false,
"format": null,
"distance": 30,
"align": "center",
"inside": null,
"allowOverlap": false,
"style": {
"fontSize": "11px"
}
},
"showInLegend": null,
"turboThreshold": 0,
"stacking": "",
"groupPadding": 0.2,
"centerInCategory": false,
"findNearestPointBy": "x"
}
},
"navigator": {
"enabled": false
},
"scrollbar": {
"enabled": false
},
"rangeSelector": {
"enabled": false,
"inputEnabled": false
},
"legend": {
"enabled": null,
"maxHeight": null,
"align": "center",
"verticalAlign": "bottom",
"layout": "horizontal",
"width": null,
"margin": 12,
"reversed": false
},
"series": [
{
"name": "c5a.12xlarge by Amazon Web Services",
"color": "#f7981d",
"data": [
{
"x": 1030.741885555824,
"y": 22671.151427771063
},
{
"x": 1047.1598184903573,
"y": 22349.991022966926
},
{
"x": 1027.6638856721722,
"y": 22799.34152843739
},
{
"x": 1039.9535239049433,
"y": 22493.852066884712
},
{
"x": 1028.105840654612,
"y": 22952.176607564666
},
{
"x": 1029.381475261496,
"y": 22124.918161713904
},
{
"x": 1029.2198150833917,
"y": 22908.4038255446
},
{
"x": 1042.9535225813065,
"y": 22725.01488065679
},
{
"x": 1023.3687553431009,
"y": 22892.667002975046
},
{
"x": 1043.3042195045055,
"y": 22414.993834980287
},
{
"x": 1031.5954345433352,
"y": 22937.901298013756
},
{
"x": 1041.8641952288633,
"y": 22640.177382227135
},
{
"x": 1029.0342192457101,
"y": 22919.065899073987
},
{
"x": 1036.3204070131637,
"y": 21522.86763851705
},
{
"x": 1041.991028744018,
"y": 22849.03126080223
},
{
"x": 1043.225979049484,
"y": 22501.873136963375
},
{
"x": 1039.3790548798204,
"y": 22688.630814321994
},
{
"x": 1045.7399465633607,
"y": 22231.726800519442
},
{
"x": 1032.8033637618166,
"y": 22864.9371581217
},
{
"x": 1036.477052844866,
"y": 22538.972451833783
},
{
"x": 1026.5230710086469,
"y": 22819.702270680595
},
{
"x": 1033.058107457394,
"y": 22772.7407660733
},
{
"x": 1034.5748510970993,
"y": 22681.07955632192
},
{
"x": 1036.2246090379372,
"y": 22855.21825495179
},
{
"x": 1029.9918740815922,
"y": 22710.67475559304
},
{
"x": 1040.682221373707,
"y": 22837.39654651059
},
{
"x": 1038.664577704487,
"y": 23115.223198047403
},
{
"x": 1031.550099585494,
"y": 22955.00571181808
},
{
"x": 1022.6108477317728,
"y": 22687.56122217358
},
{
"x": 1036.8495430099667,
"y": 22886.381101518105
},
{
"x": 1033.8171158163832,
"y": 23068.733018124647
},
{
"x": 1037.5438331800494,
"y": 22906.68876844141
},
{
"x": 1026.9549965435497,
"y": 22825.903454833693
},
{
"x": 1039.4992792775327,
"y": 22672.83146924078
},
{
"x": 1027.2088230085214,
"y": 22858.464732743098
},
{
"x": 1035.9450415263514,
"y": 22754.99765324979
},
{
"x": 1037.0272755953324,
"y": 22672.2556337246
},
{
"x": 1033.0739263028242,
"y": 22410.760197275362
},
{
"x": 1032.459322960368,
"y": 22942.501777202524
},
{
"x": 1046.6394972915148,
"y": 22922.757400591487
}
]
}
],
"drilldown": {},
"tooltip": {
"enabled": true,
"useHTML": false,
"format": null,
"headerFormat": "",
"pointFormat": "<span style=\"color:{series.color}\">Single</span>: <b>{point.x:.0f}</b><br><span style=\"color:{series.color}\">Multi</span>: <b>{point.y:.0f}</b>",
"footerFormat": "",
"shared": false,
"outside": false,
"valueDecimals": null,
"split": false
},
"annotations": null
},
"hc_type": "chart",
"id": "286088989086355280079412522739400908556"
}
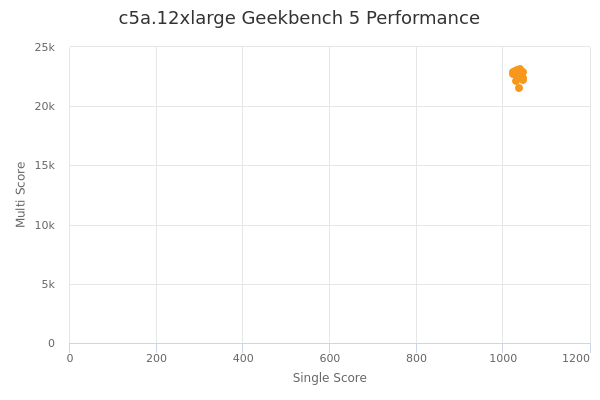
| Single | Multi | |
|---|---|---|
| Max | 1047 | 23115 |
| Average | 1035 | 22710 |
| Deviation | 6.32 | 287.58 |
| Min | 1023 | 21523 |
Sign up as Freemium to get more insight.
- In same series
- c5a.large
- c5a.xlarge
- c5a.2xlarge
- c5a.4xlarge
- c5a.8xlarge
- c5a.12xlarge
- c5a.16xlarge
- c5a.24xlarge