c5a.8xlarge by Amazon Web Services
Geekbench is a cross-platform processor benchmark with a scoring system that determines single-core and multi-core performance using loads simulating real-world scenarios. Geekbench 5 score is calculated with a reference score of 2500 representing the performance of the Intel Core i5-2520M @ 2.50 GHz. The software benchmark is available for Mac OS, Windows, Linux, Android and iOS platforms.
Specifications:
CPU
32
RAM
64.0 GB
Net
10000 Mbps
{
"configuration": {
"chart": {
"type": "scatter",
"polar": false,
"zoomType": "",
"options3d": {},
"height": null,
"width": null,
"margin": null,
"inverted": false,
"zooming": {}
},
"credits": {
"enabled": false
},
"title": {
"text": ""
},
"colorAxis": null,
"subtitle": {
"text": ""
},
"xAxis": {
"title": {
"text": [
"Single Score"
],
"useHTML": false,
"style": {
"color": "#666666"
}
},
"categories": null,
"lineWidth": 1,
"tickInterval": null,
"tickWidth": 1,
"tickLength": 10,
"tickPixelInterval": 100,
"plotLines": null,
"labels": {
"enabled": true,
"format": null,
"formatter": "",
"style": {
"color": "#666666",
"cursor": "default",
"fontSize": "11px"
},
"useHTML": false,
"step": 0
},
"plotBands": null,
"visible": true,
"floor": null,
"ceiling": null,
"type": "linear",
"min": 0,
"gridLineWidth": 1,
"gridLineColor": "#e6e6e6",
"minorTickInterval": null,
"minorTickWidth": 0,
"minTickInterval": null,
"startOnTick": true,
"endOnTick": true,
"tickmarkPlacement": 100,
"units": 100,
"minRange": 100
},
"yAxis": {
"title": {
"text": [
"Multi Score"
],
"useHTML": false,
"style": {
"color": "#666666"
}
},
"categories": null,
"plotLines": null,
"plotBands": null,
"lineWidth": null,
"tickInterval": null,
"tickLength": 10,
"floor": null,
"ceiling": null,
"gridLineInterpolation": null,
"gridLineWidth": 1,
"gridLineColor": "#e6e6e6",
"min": 0,
"max": null,
"minorTickInterval": null,
"minorTickWidth": 0,
"minTickInterval": null,
"startOnTick": true,
"endOnTick": true,
"minRange": null,
"type": "linear",
"tickmarkPlacement": null,
"labels": {
"enabled": true,
"formatter": null,
"style": {
"color": "#666666",
"cursor": "default",
"fontSize": "11px"
},
"useHTML": false
}
},
"zAxis": {
"title": {
"text": "Multi Score"
}
},
"plotOptions": {
"series": {
"dataLabels": {
"enabled": false,
"format": null,
"distance": 30,
"align": "center",
"inside": null,
"allowOverlap": false,
"style": {
"fontSize": "11px"
}
},
"showInLegend": null,
"turboThreshold": 0,
"stacking": "",
"groupPadding": 0.2,
"centerInCategory": false,
"findNearestPointBy": "x"
}
},
"navigator": {
"enabled": false
},
"scrollbar": {
"enabled": false
},
"rangeSelector": {
"enabled": false,
"inputEnabled": false
},
"legend": {
"enabled": null,
"maxHeight": null,
"align": "center",
"verticalAlign": "bottom",
"layout": "horizontal",
"width": null,
"margin": 12,
"reversed": false
},
"series": [
{
"name": "c5a.8xlarge by Amazon Web Services",
"color": "#f7981d",
"data": [
{
"x": 1048.9081631379204,
"y": 16048.584221520898
},
{
"x": 1015.8181104310745,
"y": 15942.692689130854
},
{
"x": 1044.7820464520312,
"y": 16065.110982571694
},
{
"x": 1013.2220516752124,
"y": 16051.543793984969
},
{
"x": 1040.7714658314217,
"y": 16099.093699032725
},
{
"x": 1012.6441604377299,
"y": 15885.399829266968
},
{
"x": 1040.7393423685435,
"y": 16008.67686319153
},
{
"x": 1015.0614689230017,
"y": 15868.37777991116
},
{
"x": 1043.6691221936132,
"y": 15995.320609376784
},
{
"x": 1011.5886426909155,
"y": 16006.35095685161
},
{
"x": 1044.0891556839865,
"y": 16110.678176854042
},
{
"x": 1010.933504702682,
"y": 16076.763046780836
},
{
"x": 1036.6141010670854,
"y": 16072.321611538628
},
{
"x": 1012.87271311774,
"y": 15995.65432963458
},
{
"x": 1041.3988629165865,
"y": 16102.490690789069
},
{
"x": 1009.977944586182,
"y": 16030.435970567632
},
{
"x": 1046.2028909806584,
"y": 16057.122360097605
},
{
"x": 1009.4943002702544,
"y": 15924.547179848843
},
{
"x": 1042.5235086618814,
"y": 16045.816523299447
},
{
"x": 1012.2447235393604,
"y": 16033.965507323664
},
{
"x": 1039.1282061340999,
"y": 16098.704635279544
},
{
"x": 1042.0096601311066,
"y": 15999.432029539563
},
{
"x": 1036.1643403347723,
"y": 16329.125042566484
},
{
"x": 1032.938010481049,
"y": 16084.161704790073
},
{
"x": 1030.051618139038,
"y": 16320.813949579337
},
{
"x": 1029.6272538429014,
"y": 15799.480783197729
},
{
"x": 1031.0373926973525,
"y": 16183.24995749615
},
{
"x": 1032.688520790723,
"y": 16080.399923175844
},
{
"x": 1033.0814116614638,
"y": 16332.506021512363
},
{
"x": 1038.757483029031,
"y": 15907.890433862067
},
{
"x": 1040.4697623659335,
"y": 16139.77764097322
},
{
"x": 1036.652764907741,
"y": 16039.70150215267
},
{
"x": 1049.7538979614856,
"y": 16114.932022096382
},
{
"x": 1034.720241321845,
"y": 16030.238342976478
},
{
"x": 1046.115251578849,
"y": 16233.682827698032
},
{
"x": 1032.7583764343115,
"y": 15961.961439710962
},
{
"x": 1043.9576682365316,
"y": 16108.802585794914
},
{
"x": 1026.6893405746719,
"y": 16030.740388935259
},
{
"x": 1043.5982596230024,
"y": 16255.454513592531
},
{
"x": 1035.2185070583541,
"y": 16012.245927157375
}
]
}
],
"drilldown": {},
"tooltip": {
"enabled": true,
"useHTML": false,
"format": null,
"headerFormat": "",
"pointFormat": "<span style=\"color:{series.color}\">Single</span>: <b>{point.x:.0f}</b><br><span style=\"color:{series.color}\">Multi</span>: <b>{point.y:.0f}</b>",
"footerFormat": "",
"shared": false,
"outside": false,
"valueDecimals": null,
"split": false
},
"annotations": null
},
"hc_type": "chart",
"id": "144397123699407048940785078584092370817"
}
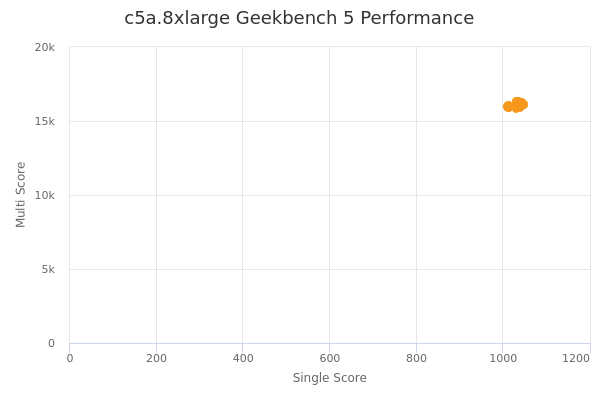
| Single | Multi | |
|---|---|---|
| Max | 1050 | 16333 |
| Average | 1032 | 16062 |
| Deviation | 12.60 | 116.46 |
| Min | 1009 | 15799 |
Sign up as Freemium to get more insight.
- In same series
- c5a.large
- c5a.xlarge
- c5a.2xlarge
- c5a.4xlarge
- c5a.8xlarge
- c5a.12xlarge
- c5a.16xlarge
- c5a.24xlarge