c5a.16xlarge by Amazon Web Services
Geekbench is a cross-platform processor benchmark with a scoring system that determines single-core and multi-core performance using loads simulating real-world scenarios. Geekbench 5 score is calculated with a reference score of 2500 representing the performance of the Intel Core i5-2520M @ 2.50 GHz. The software benchmark is available for Mac OS, Windows, Linux, Android and iOS platforms.
Specifications:
CPU
64
RAM
128.0 GB
Net
20000 Mbps
{
"configuration": {
"chart": {
"type": "scatter",
"polar": false,
"zoomType": "",
"options3d": {},
"height": null,
"width": null,
"margin": null,
"inverted": false,
"zooming": {}
},
"credits": {
"enabled": false
},
"title": {
"text": ""
},
"colorAxis": null,
"subtitle": {
"text": ""
},
"xAxis": {
"title": {
"text": [
"Single Score"
],
"useHTML": false,
"style": {
"color": "#666666"
}
},
"categories": null,
"lineWidth": 1,
"tickInterval": null,
"tickWidth": 1,
"tickLength": 10,
"tickPixelInterval": 100,
"plotLines": null,
"labels": {
"enabled": true,
"format": null,
"formatter": "",
"style": {
"color": "#666666",
"cursor": "default",
"fontSize": "11px"
},
"useHTML": false,
"step": 0
},
"plotBands": null,
"visible": true,
"floor": null,
"ceiling": null,
"type": "linear",
"min": 0,
"gridLineWidth": 1,
"gridLineColor": "#e6e6e6",
"minorTickInterval": null,
"minorTickWidth": 0,
"minTickInterval": null,
"startOnTick": true,
"endOnTick": true,
"tickmarkPlacement": 100,
"units": 100,
"minRange": 100
},
"yAxis": {
"title": {
"text": [
"Multi Score"
],
"useHTML": false,
"style": {
"color": "#666666"
}
},
"categories": null,
"plotLines": null,
"plotBands": null,
"lineWidth": null,
"tickInterval": null,
"tickLength": 10,
"floor": null,
"ceiling": null,
"gridLineInterpolation": null,
"gridLineWidth": 1,
"gridLineColor": "#e6e6e6",
"min": 0,
"max": null,
"minorTickInterval": null,
"minorTickWidth": 0,
"minTickInterval": null,
"startOnTick": true,
"endOnTick": true,
"minRange": null,
"type": "linear",
"tickmarkPlacement": null,
"labels": {
"enabled": true,
"formatter": null,
"style": {
"color": "#666666",
"cursor": "default",
"fontSize": "11px"
},
"useHTML": false
}
},
"zAxis": {
"title": {
"text": "Multi Score"
}
},
"plotOptions": {
"series": {
"dataLabels": {
"enabled": false,
"format": null,
"distance": 30,
"align": "center",
"inside": null,
"allowOverlap": false,
"style": {
"fontSize": "11px"
}
},
"showInLegend": null,
"turboThreshold": 0,
"stacking": "",
"groupPadding": 0.2,
"centerInCategory": false,
"findNearestPointBy": "x"
}
},
"navigator": {
"enabled": false
},
"scrollbar": {
"enabled": false
},
"rangeSelector": {
"enabled": false,
"inputEnabled": false
},
"legend": {
"enabled": null,
"maxHeight": null,
"align": "center",
"verticalAlign": "bottom",
"layout": "horizontal",
"width": null,
"margin": 12,
"reversed": false
},
"series": [
{
"name": "c5a.16xlarge by Amazon Web Services",
"color": "#f7981d",
"data": [
{
"x": 1016.6862343763066,
"y": 28487.101383954323
},
{
"x": 1013.3313945557557,
"y": 28488.354057278368
},
{
"x": 1016.6035567533147,
"y": 28615.519544154202
},
{
"x": 1012.8774927358143,
"y": 28450.732274069822
},
{
"x": 1021.2611673935075,
"y": 28512.483887890834
},
{
"x": 1013.6577262487189,
"y": 28227.759897454238
},
{
"x": 1012.1342435066758,
"y": 28749.849661531545
},
{
"x": 1012.1294338724447,
"y": 28230.66014452237
},
{
"x": 1013.5130457005519,
"y": 28856.153034177438
},
{
"x": 1015.8802229033536,
"y": 28315.674371876084
},
{
"x": 1018.2564959192375,
"y": 29139.1937606716
},
{
"x": 1011.3862745326949,
"y": 28751.789703291717
},
{
"x": 1017.773668341955,
"y": 28896.130827367204
},
{
"x": 1011.8017926426796,
"y": 28844.542129229747
},
{
"x": 1016.3709845036349,
"y": 28599.242027786313
},
{
"x": 1014.0061653549944,
"y": 28522.320607851318
},
{
"x": 1015.1232515338993,
"y": 28383.450687380286
},
{
"x": 1012.112289403273,
"y": 28571.02283889051
},
{
"x": 1019.4208692611712,
"y": 28596.311439558063
},
{
"x": 1011.2713929790693,
"y": 28512.07723934135
}
]
}
],
"drilldown": {},
"tooltip": {
"enabled": true,
"useHTML": false,
"format": null,
"headerFormat": "",
"pointFormat": "<span style=\"color:{series.color}\">Single</span>: <b>{point.x:.0f}</b><br><span style=\"color:{series.color}\">Multi</span>: <b>{point.y:.0f}</b>",
"footerFormat": "",
"shared": false,
"outside": false,
"valueDecimals": null,
"split": false
},
"annotations": null
},
"hc_type": "chart",
"id": "233754531975928338191731594486053675170"
}
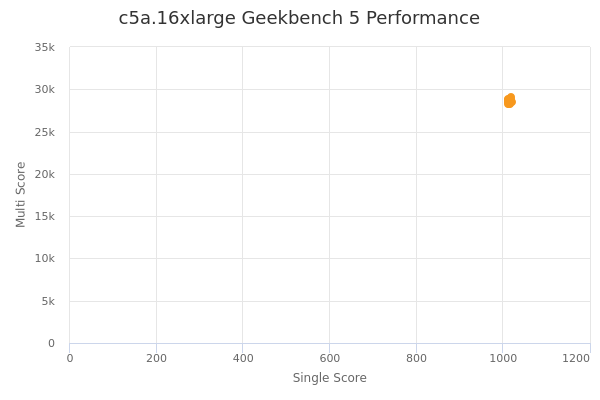
| Single | Multi | |
|---|---|---|
| Max | 1021 | 29139 |
| Average | 1015 | 28588 |
| Deviation | 2.81 | 225.71 |
| Min | 1011 | 28228 |
Sign up as Freemium to get more insight.
- In same series
- c5a.large
- c5a.xlarge
- c5a.2xlarge
- c5a.4xlarge
- c5a.8xlarge
- c5a.12xlarge
- c5a.16xlarge
- c5a.24xlarge