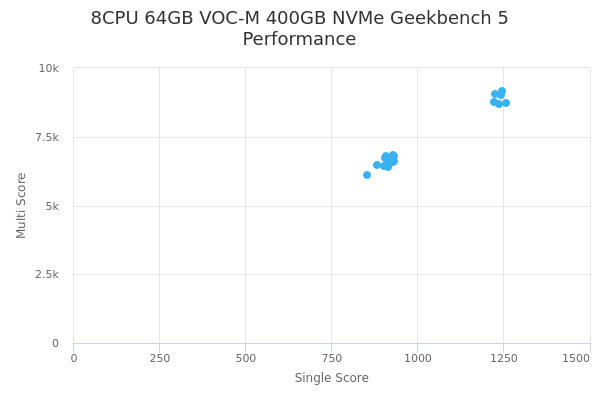
8CPU 64GB VOC-M 400GB NVMe by Vultr
Geekbench is a cross-platform processor benchmark with a scoring system that determines single-core and multi-core performance using loads simulating real-world scenarios. Geekbench 5 score is calculated with a reference score of 2500 representing the performance of the Intel Core i5-2520M @ 2.50 GHz. The software benchmark is available for Mac OS, Windows, Linux, Android and iOS platforms.
Specifications:
CPU
8
RAM
64.0 GB
Root
400 GB
8CPU 64GB VOC-M 400GB NVMe root
{
"configuration": {
"chart": {
"type": "scatter",
"polar": false,
"zoomType": "",
"options3d": {},
"height": null,
"width": null,
"margin": null,
"inverted": false,
"zooming": {}
},
"credits": {
"enabled": false
},
"title": {
"text": ""
},
"colorAxis": null,
"subtitle": {
"text": ""
},
"xAxis": {
"title": {
"text": [
"Single Score"
],
"useHTML": false,
"style": {
"color": "#666666"
}
},
"categories": null,
"lineWidth": 1,
"tickInterval": null,
"tickWidth": 1,
"tickLength": 10,
"tickPixelInterval": 100,
"plotLines": null,
"labels": {
"enabled": true,
"format": null,
"formatter": "",
"style": {
"color": "#666666",
"cursor": "default",
"fontSize": "11px"
},
"useHTML": false,
"step": 0
},
"plotBands": null,
"visible": true,
"floor": null,
"ceiling": null,
"type": "linear",
"min": 0,
"gridLineWidth": 1,
"gridLineColor": "#e6e6e6",
"minorTickInterval": null,
"minorTickWidth": 0,
"minTickInterval": null,
"startOnTick": true,
"endOnTick": true,
"tickmarkPlacement": 100,
"units": 100,
"minRange": 100
},
"yAxis": {
"title": {
"text": [
"Multi Score"
],
"useHTML": false,
"style": {
"color": "#666666"
}
},
"categories": null,
"plotLines": null,
"plotBands": null,
"lineWidth": null,
"tickInterval": null,
"tickLength": 10,
"floor": null,
"ceiling": null,
"gridLineInterpolation": null,
"gridLineWidth": 1,
"gridLineColor": "#e6e6e6",
"min": 0,
"max": null,
"minorTickInterval": null,
"minorTickWidth": 0,
"minTickInterval": null,
"startOnTick": true,
"endOnTick": true,
"minRange": null,
"type": "linear",
"tickmarkPlacement": null,
"labels": {
"enabled": true,
"formatter": null,
"style": {
"color": "#666666",
"cursor": "default",
"fontSize": "11px"
},
"useHTML": false
}
},
"zAxis": {
"title": {
"text": "Multi Score"
}
},
"plotOptions": {
"series": {
"dataLabels": {
"enabled": false,
"format": null,
"distance": 30,
"align": "center",
"inside": null,
"allowOverlap": false,
"style": {
"fontSize": "11px"
}
},
"showInLegend": null,
"turboThreshold": 0,
"stacking": "",
"groupPadding": 0.2,
"centerInCategory": false,
"findNearestPointBy": "x"
}
},
"navigator": {
"enabled": false
},
"scrollbar": {
"enabled": false
},
"rangeSelector": {
"enabled": false,
"inputEnabled": false
},
"legend": {
"enabled": null,
"maxHeight": null,
"align": "center",
"verticalAlign": "bottom",
"layout": "horizontal",
"width": null,
"margin": 12,
"reversed": false
},
"series": [
{
"name": "8CPU 64GB VOC-M 400GB NVMe by Vultr",
"color": "#3AB1F2",
"data": [
{
"x": 926.8467128490945,
"y": 6588.057668021045
},
{
"x": 882.628184674719,
"y": 6471.873204313333
},
{
"x": 918.7677655796085,
"y": 6710.781368567036
},
{
"x": 919.8232945072605,
"y": 6624.122907654894
},
{
"x": 929.7545631843241,
"y": 6826.10891325577
},
{
"x": 928.0249300329655,
"y": 6584.316146270964
},
{
"x": 913.5553598800739,
"y": 6641.9591010136655
},
{
"x": 923.9593198085923,
"y": 6574.841445462214
},
{
"x": 929.7069241016227,
"y": 6612.636363782489
},
{
"x": 902.4402612495944,
"y": 6454.118138623212
},
{
"x": 904.3745634276297,
"y": 6741.761588893925
},
{
"x": 913.0319970791209,
"y": 6383.677101941382
},
{
"x": 915.3382757416546,
"y": 6743.849289784067
},
{
"x": 853.2159846132438,
"y": 6124.668716379745
},
{
"x": 930.518091788789,
"y": 6618.1282918129
},
{
"x": 919.2257756451065,
"y": 6627.279239294716
},
{
"x": 916.5264578723823,
"y": 6697.262037965294
},
{
"x": 907.3635372341247,
"y": 6795.717726428014
},
{
"x": 930.449739850053,
"y": 6796.559000177509
},
{
"x": 920.5058132861528,
"y": 6541.273131629107
},
{
"x": 1241.6004792025694,
"y": 9013.427642032435
},
{
"x": 1223.7626413136622,
"y": 8750.371863926286
},
{
"x": 1257.1846290829644,
"y": 8718.497824246164
},
{
"x": 1225.1411587199855,
"y": 9059.340091366359
},
{
"x": 1245.7795777504498,
"y": 9145.469800988241
},
{
"x": 1237.1585243004818,
"y": 8691.664534922129
}
]
}
],
"drilldown": {},
"tooltip": {
"enabled": true,
"useHTML": false,
"format": null,
"headerFormat": "",
"pointFormat": "<span style=\"color:{series.color}\">Single</span>: <b>{point.x:.0f}</b><br><span style=\"color:{series.color}\">Multi</span>: <b>{point.y:.0f}</b>",
"footerFormat": "",
"shared": false,
"outside": false,
"valueDecimals": null,
"split": false
},
"annotations": null
},
"hc_type": "chart",
"id": "86301775760790779984492782266139609629"
}
| Single | Multi | |
|---|---|---|
| Max | 1257 | 9145 |
| Average | 989 | 7136 |
| Deviation | 137.60 | 978.17 |
| Min | 853 | 6125 |
Sign up as Freemium to get more insight.
- In same series
- 1CPU 8GB VOC-M 50GB NVMe
- 2CPU 16GB VOC-M 100GB NVMe
- 2CPU 16GB VOC-M 200GB NVMe
- 2CPU 16GB VOC-M 400GB NVMe
- 4CPU 32GB VOC-M 200GB NVMe
- 4CPU 32GB VOC-M 400GB NVMe
- 4CPU 32GB VOC-M 800GB NVMe
- 8CPU 64GB VOC-M 1600GB NVMe
- 8CPU 64GB VOC-M 400GB NVMe
- 8CPU 64GB VOC-M 800GB NVMe
- 16CPU 128GB VOC-M 1600GB NVMe
- 16CPU 128GB VOC-M 3200GB NVMe
- 16CPU 128GB VOC-M 800GB NVMe
- 24CPU 192GB VOC-M 1200GB NVMe
- 24CPU 192GB VOC-M 2400GB NVMe
- 24CPU 192GB VOC-M 4800GB NVMe
- 32CPU 256GB VOC-M 1600GB NVMe
- 32CPU 256GB VOC-M 3200GB NVMe