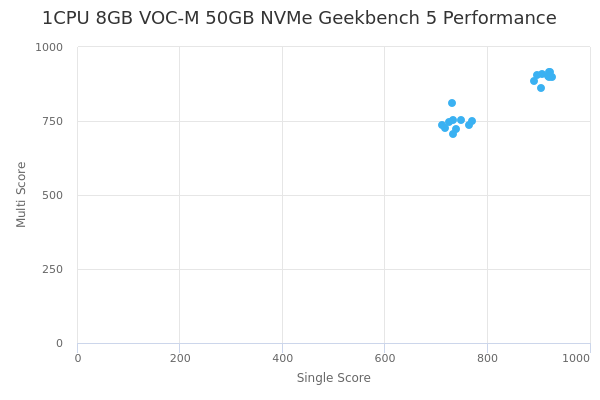
1CPU 8GB VOC-M 50GB NVMe by Vultr
Geekbench is a cross-platform processor benchmark with a scoring system that determines single-core and multi-core performance using loads simulating real-world scenarios. Geekbench 5 score is calculated with a reference score of 2500 representing the performance of the Intel Core i5-2520M @ 2.50 GHz. The software benchmark is available for Mac OS, Windows, Linux, Android and iOS platforms.
Specifications:
CPU
1
RAM
8.0 GB
Root
50 GB
1CPU 8GB VOC-M 50GB NVMe root
{
"configuration": {
"chart": {
"type": "scatter",
"polar": false,
"zoomType": "",
"options3d": {},
"height": null,
"width": null,
"margin": null,
"inverted": false,
"zooming": {}
},
"credits": {
"enabled": false
},
"title": {
"text": ""
},
"colorAxis": null,
"subtitle": {
"text": ""
},
"xAxis": {
"title": {
"text": [
"Single Score"
],
"useHTML": false,
"style": {
"color": "#666666"
}
},
"categories": null,
"lineWidth": 1,
"tickInterval": null,
"tickWidth": 1,
"tickLength": 10,
"tickPixelInterval": 100,
"plotLines": null,
"labels": {
"enabled": true,
"format": null,
"formatter": "",
"style": {
"color": "#666666",
"cursor": "default",
"fontSize": "11px"
},
"useHTML": false,
"step": 0
},
"plotBands": null,
"visible": true,
"floor": null,
"ceiling": null,
"type": "linear",
"min": 0,
"gridLineWidth": 1,
"gridLineColor": "#e6e6e6",
"minorTickInterval": null,
"minorTickWidth": 0,
"minTickInterval": null,
"startOnTick": true,
"endOnTick": true,
"tickmarkPlacement": 100,
"units": 100,
"minRange": 100
},
"yAxis": {
"title": {
"text": [
"Multi Score"
],
"useHTML": false,
"style": {
"color": "#666666"
}
},
"categories": null,
"plotLines": null,
"plotBands": null,
"lineWidth": null,
"tickInterval": null,
"tickLength": 10,
"floor": null,
"ceiling": null,
"gridLineInterpolation": null,
"gridLineWidth": 1,
"gridLineColor": "#e6e6e6",
"min": 0,
"max": null,
"minorTickInterval": null,
"minorTickWidth": 0,
"minTickInterval": null,
"startOnTick": true,
"endOnTick": true,
"minRange": null,
"type": "linear",
"tickmarkPlacement": null,
"labels": {
"enabled": true,
"formatter": null,
"style": {
"color": "#666666",
"cursor": "default",
"fontSize": "11px"
},
"useHTML": false
}
},
"zAxis": {
"title": {
"text": "Multi Score"
}
},
"plotOptions": {
"series": {
"dataLabels": {
"enabled": false,
"format": null,
"distance": 30,
"align": "center",
"inside": null,
"allowOverlap": false,
"style": {
"fontSize": "11px"
}
},
"showInLegend": null,
"turboThreshold": 0,
"stacking": "",
"groupPadding": 0.2,
"centerInCategory": false,
"findNearestPointBy": "x"
}
},
"navigator": {
"enabled": false
},
"scrollbar": {
"enabled": false
},
"rangeSelector": {
"enabled": false,
"inputEnabled": false
},
"legend": {
"enabled": null,
"maxHeight": null,
"align": "center",
"verticalAlign": "bottom",
"layout": "horizontal",
"width": null,
"margin": 12,
"reversed": false
},
"series": [
{
"name": "1CPU 8GB VOC-M 50GB NVMe by Vultr",
"color": "#3AB1F2",
"data": [
{
"x": 927.0420104203438,
"y": 899.3174368451862
},
{
"x": 733.8259631225103,
"y": 706.9777949195644
},
{
"x": 904.6103697189087,
"y": 862.55764916433
},
{
"x": 765.1754780426365,
"y": 735.9940521797898
},
{
"x": 896.5626812716894,
"y": 905.1518569538641
},
{
"x": 711.5021976966187,
"y": 735.838267671226
},
{
"x": 918.9969507234343,
"y": 902.093046887943
},
{
"x": 725.8520113713209,
"y": 746.6618671653714
},
{
"x": 920.0141542356062,
"y": 899.2269619575507
},
{
"x": 717.2603229545521,
"y": 727.8885365733897
},
{
"x": 907.3832713256711,
"y": 908.6686247852372
},
{
"x": 771.1966591212582,
"y": 748.3803690449229
},
{
"x": 920.7991581595054,
"y": 900.6114422724802
},
{
"x": 739.3901120654524,
"y": 723.7821278499223
},
{
"x": 891.094980662388,
"y": 885.1261570652721
},
{
"x": 749.942521780352,
"y": 753.6774903497995
},
{
"x": 920.9842899603566,
"y": 916.9030047666843
},
{
"x": 922.4421629489888,
"y": 916.7733350383719
},
{
"x": 733.7146179992992,
"y": 751.9414471064416
},
{
"x": 731.4502290561095,
"y": 809.1742563386824
}
]
}
],
"drilldown": {},
"tooltip": {
"enabled": true,
"useHTML": false,
"format": null,
"headerFormat": "",
"pointFormat": "<span style=\"color:{series.color}\">Single</span>: <b>{point.x:.0f}</b><br><span style=\"color:{series.color}\">Multi</span>: <b>{point.y:.0f}</b>",
"footerFormat": "",
"shared": false,
"outside": false,
"valueDecimals": null,
"split": false
},
"annotations": null
},
"hc_type": "chart",
"id": "59774885012872911854919096627855550554"
}
| Single | Multi | |
|---|---|---|
| Max | 927 | 917 |
| Average | 825 | 822 |
| Deviation | 88.86 | 80.61 |
| Min | 712 | 707 |
Sign up as Freemium to get more insight.
- In same series
- 1CPU 8GB VOC-M 50GB NVMe
- 2CPU 16GB VOC-M 100GB NVMe
- 2CPU 16GB VOC-M 200GB NVMe
- 2CPU 16GB VOC-M 400GB NVMe
- 4CPU 32GB VOC-M 200GB NVMe
- 4CPU 32GB VOC-M 400GB NVMe
- 4CPU 32GB VOC-M 800GB NVMe
- 8CPU 64GB VOC-M 1600GB NVMe
- 8CPU 64GB VOC-M 400GB NVMe
- 8CPU 64GB VOC-M 800GB NVMe
- 16CPU 128GB VOC-M 1600GB NVMe
- 16CPU 128GB VOC-M 3200GB NVMe
- 16CPU 128GB VOC-M 800GB NVMe
- 24CPU 192GB VOC-M 1200GB NVMe
- 24CPU 192GB VOC-M 2400GB NVMe
- 24CPU 192GB VOC-M 4800GB NVMe
- 32CPU 256GB VOC-M 1600GB NVMe
- 32CPU 256GB VOC-M 3200GB NVMe