8CPU 64GB VOC-M 1600GB NVMe by Vultr
Geekbench is a cross-platform processor benchmark with a scoring system that determines single-core and multi-core performance using loads simulating real-world scenarios. Geekbench 5 score is calculated with a reference score of 2500 representing the performance of the Intel Core i5-2520M @ 2.50 GHz. The software benchmark is available for Mac OS, Windows, Linux, Android and iOS platforms.
Specifications:
CPU
8
RAM
64.0 GB
Root
1600 GB
8CPU 64GB VOC-M 1600GB NVMe root
{
"configuration": {
"chart": {
"type": "scatter",
"polar": false,
"zoomType": "",
"options3d": {},
"height": null,
"width": null,
"margin": null,
"inverted": false,
"zooming": {}
},
"credits": {
"enabled": false
},
"title": {
"text": ""
},
"colorAxis": null,
"subtitle": {
"text": ""
},
"xAxis": {
"title": {
"text": [
"Single Score"
],
"useHTML": false,
"style": {
"color": "#666666"
}
},
"categories": null,
"lineWidth": 1,
"tickInterval": null,
"tickWidth": 1,
"tickLength": 10,
"tickPixelInterval": 100,
"plotLines": null,
"labels": {
"enabled": true,
"format": null,
"formatter": "",
"style": {
"color": "#666666",
"cursor": "default",
"fontSize": "11px"
},
"useHTML": false,
"step": 0
},
"plotBands": null,
"visible": true,
"floor": null,
"ceiling": null,
"type": "linear",
"min": 0,
"gridLineWidth": 1,
"gridLineColor": "#e6e6e6",
"minorTickInterval": null,
"minorTickWidth": 0,
"minTickInterval": null,
"startOnTick": true,
"endOnTick": true,
"tickmarkPlacement": 100,
"units": 100,
"minRange": 100
},
"yAxis": {
"title": {
"text": [
"Multi Score"
],
"useHTML": false,
"style": {
"color": "#666666"
}
},
"categories": null,
"plotLines": null,
"plotBands": null,
"lineWidth": null,
"tickInterval": null,
"tickLength": 10,
"floor": null,
"ceiling": null,
"gridLineInterpolation": null,
"gridLineWidth": 1,
"gridLineColor": "#e6e6e6",
"min": 0,
"max": null,
"minorTickInterval": null,
"minorTickWidth": 0,
"minTickInterval": null,
"startOnTick": true,
"endOnTick": true,
"minRange": null,
"type": "linear",
"tickmarkPlacement": null,
"labels": {
"enabled": true,
"formatter": null,
"style": {
"color": "#666666",
"cursor": "default",
"fontSize": "11px"
},
"useHTML": false
}
},
"zAxis": {
"title": {
"text": "Multi Score"
}
},
"plotOptions": {
"series": {
"dataLabels": {
"enabled": false,
"format": null,
"distance": 30,
"align": "center",
"inside": null,
"allowOverlap": false,
"style": {
"fontSize": "11px"
}
},
"showInLegend": null,
"turboThreshold": 0,
"stacking": "",
"groupPadding": 0.2,
"centerInCategory": false,
"findNearestPointBy": "x"
}
},
"navigator": {
"enabled": false
},
"scrollbar": {
"enabled": false
},
"rangeSelector": {
"enabled": false,
"inputEnabled": false
},
"legend": {
"enabled": null,
"maxHeight": null,
"align": "center",
"verticalAlign": "bottom",
"layout": "horizontal",
"width": null,
"margin": 12,
"reversed": false
},
"series": [
{
"name": "8CPU 64GB VOC-M 1600GB NVMe by Vultr",
"color": "#3AB1F2",
"data": [
{
"x": 936.8786019143677,
"y": 6938.808859739067
},
{
"x": 929.526234746327,
"y": 6587.905017205023
},
{
"x": 931.2702712887585,
"y": 7063.98439483774
},
{
"x": 921.9705910507862,
"y": 6623.66189011618
},
{
"x": 946.6679146694282,
"y": 7074.873716390095
},
{
"x": 921.1912950019253,
"y": 6535.777354524968
},
{
"x": 940.4662046868268,
"y": 6919.383287858645
},
{
"x": 912.1663536239811,
"y": 6506.00403121072
},
{
"x": 943.8783207196168,
"y": 6972.469486528336
},
{
"x": 917.6134156177119,
"y": 6731.234179810808
},
{
"x": 943.8269770790689,
"y": 6920.691485590482
},
{
"x": 915.880697855104,
"y": 6799.720159815622
},
{
"x": 934.0485625006961,
"y": 6918.286525685223
},
{
"x": 926.6718721458494,
"y": 6696.4845344670375
},
{
"x": 944.1307672738972,
"y": 6988.7228223494585
},
{
"x": 929.05430349783,
"y": 6789.632605271252
},
{
"x": 936.3709678251895,
"y": 7056.066945263688
},
{
"x": 934.603821823735,
"y": 6669.115984153335
},
{
"x": 936.5609187222949,
"y": 6994.0840551218835
},
{
"x": 924.3559182284066,
"y": 6576.336142619947
}
]
}
],
"drilldown": {},
"tooltip": {
"enabled": true,
"useHTML": false,
"format": null,
"headerFormat": "",
"pointFormat": "<span style=\"color:{series.color}\">Single</span>: <b>{point.x:.0f}</b><br><span style=\"color:{series.color}\">Multi</span>: <b>{point.y:.0f}</b>",
"footerFormat": "",
"shared": false,
"outside": false,
"valueDecimals": null,
"split": false
},
"annotations": null
},
"hc_type": "chart",
"id": "89762206066828751882773191432139365472"
}
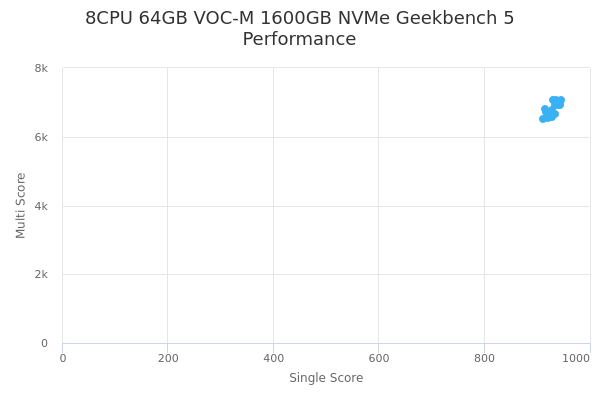
| Single | Multi | |
|---|---|---|
| Max | 947 | 7075 |
| Average | 931 | 6818 |
| Deviation | 9.90 | 184.98 |
| Min | 912 | 6506 |
Sign up as Freemium to get more insight.
- In same series
- 1CPU 8GB VOC-M 50GB NVMe
- 2CPU 16GB VOC-M 100GB NVMe
- 2CPU 16GB VOC-M 200GB NVMe
- 2CPU 16GB VOC-M 400GB NVMe
- 4CPU 32GB VOC-M 200GB NVMe
- 4CPU 32GB VOC-M 400GB NVMe
- 4CPU 32GB VOC-M 800GB NVMe
- 8CPU 64GB VOC-M 1600GB NVMe
- 8CPU 64GB VOC-M 400GB NVMe
- 8CPU 64GB VOC-M 800GB NVMe
- 16CPU 128GB VOC-M 1600GB NVMe
- 16CPU 128GB VOC-M 3200GB NVMe
- 16CPU 128GB VOC-M 800GB NVMe
- 24CPU 192GB VOC-M 1200GB NVMe
- 24CPU 192GB VOC-M 2400GB NVMe
- 24CPU 192GB VOC-M 4800GB NVMe
- 32CPU 256GB VOC-M 1600GB NVMe
- 32CPU 256GB VOC-M 3200GB NVMe