2CPU 16GB VOC-M 200GB NVMe by Vultr
Geekbench is a cross-platform processor benchmark with a scoring system that determines single-core and multi-core performance using loads simulating real-world scenarios. Geekbench 5 score is calculated with a reference score of 2500 representing the performance of the Intel Core i5-2520M @ 2.50 GHz. The software benchmark is available for Mac OS, Windows, Linux, Android and iOS platforms.
Specifications:
CPU
2
RAM
16.0 GB
Root
200 GB
2CPU 16GB VOC-M 200GB NVMe root
{
"configuration": {
"chart": {
"type": "scatter",
"polar": false,
"zoomType": "",
"options3d": {},
"height": null,
"width": null,
"margin": null,
"inverted": false,
"zooming": {}
},
"credits": {
"enabled": false
},
"title": {
"text": ""
},
"colorAxis": null,
"subtitle": {
"text": ""
},
"xAxis": {
"title": {
"text": [
"Single Score"
],
"useHTML": false,
"style": {
"color": "#666666"
}
},
"categories": null,
"lineWidth": 1,
"tickInterval": null,
"tickWidth": 1,
"tickLength": 10,
"tickPixelInterval": 100,
"plotLines": null,
"labels": {
"enabled": true,
"format": null,
"formatter": "",
"style": {
"color": "#666666",
"cursor": "default",
"fontSize": "11px"
},
"useHTML": false,
"step": 0
},
"plotBands": null,
"visible": true,
"floor": null,
"ceiling": null,
"type": "linear",
"min": 0,
"gridLineWidth": 1,
"gridLineColor": "#e6e6e6",
"minorTickInterval": null,
"minorTickWidth": 0,
"minTickInterval": null,
"startOnTick": true,
"endOnTick": true,
"tickmarkPlacement": 100,
"units": 100,
"minRange": 100
},
"yAxis": {
"title": {
"text": [
"Multi Score"
],
"useHTML": false,
"style": {
"color": "#666666"
}
},
"categories": null,
"plotLines": null,
"plotBands": null,
"lineWidth": null,
"tickInterval": null,
"tickLength": 10,
"floor": null,
"ceiling": null,
"gridLineInterpolation": null,
"gridLineWidth": 1,
"gridLineColor": "#e6e6e6",
"min": 0,
"max": null,
"minorTickInterval": null,
"minorTickWidth": 0,
"minTickInterval": null,
"startOnTick": true,
"endOnTick": true,
"minRange": null,
"type": "linear",
"tickmarkPlacement": null,
"labels": {
"enabled": true,
"formatter": null,
"style": {
"color": "#666666",
"cursor": "default",
"fontSize": "11px"
},
"useHTML": false
}
},
"zAxis": {
"title": {
"text": "Multi Score"
}
},
"plotOptions": {
"series": {
"dataLabels": {
"enabled": false,
"format": null,
"distance": 30,
"align": "center",
"inside": null,
"allowOverlap": false,
"style": {
"fontSize": "11px"
}
},
"showInLegend": null,
"turboThreshold": 0,
"stacking": "",
"groupPadding": 0.2,
"centerInCategory": false,
"findNearestPointBy": "x"
}
},
"navigator": {
"enabled": false
},
"scrollbar": {
"enabled": false
},
"rangeSelector": {
"enabled": false,
"inputEnabled": false
},
"legend": {
"enabled": null,
"maxHeight": null,
"align": "center",
"verticalAlign": "bottom",
"layout": "horizontal",
"width": null,
"margin": 12,
"reversed": false
},
"series": [
{
"name": "2CPU 16GB VOC-M 200GB NVMe by Vultr",
"color": "#3AB1F2",
"data": [
{
"x": 906.4522602642436,
"y": 1795.7990187341295
},
{
"x": 695.763534481002,
"y": 1351.2311104289442
},
{
"x": 908.5808041163157,
"y": 1762.6437946656465
},
{
"x": 736.5595540528243,
"y": 1290.5754165408825
},
{
"x": 899.3386211342163,
"y": 1796.8351641438671
},
{
"x": 747.6071021093254,
"y": 1400.831579841326
},
{
"x": 920.8946885803846,
"y": 1774.3692871032208
},
{
"x": 793.1304594213749,
"y": 1559.7021100095394
},
{
"x": 907.7217168325478,
"y": 1772.3268207105316
},
{
"x": 776.8298296355035,
"y": 1468.1495745701588
},
{
"x": 911.9822887446792,
"y": 1711.0738780687952
},
{
"x": 816.9907074202458,
"y": 1560.4804082385974
},
{
"x": 914.3641018091603,
"y": 1763.050592064354
},
{
"x": 677.1492550465563,
"y": 1593.173027195594
},
{
"x": 933.0832254095935,
"y": 1788.8420272225708
},
{
"x": 845.3099472366254,
"y": 1658.1076406877255
},
{
"x": 945.8057104840285,
"y": 1758.3066274095604
},
{
"x": 886.023035484799,
"y": 1723.334744787956
},
{
"x": 906.7350931314911,
"y": 1828.1754420556913
},
{
"x": 902.9351952823692,
"y": 1685.881734029732
}
]
}
],
"drilldown": {},
"tooltip": {
"enabled": true,
"useHTML": false,
"format": null,
"headerFormat": "",
"pointFormat": "<span style=\"color:{series.color}\">Single</span>: <b>{point.x:.0f}</b><br><span style=\"color:{series.color}\">Multi</span>: <b>{point.y:.0f}</b>",
"footerFormat": "",
"shared": false,
"outside": false,
"valueDecimals": null,
"split": false
},
"annotations": null
},
"hc_type": "chart",
"id": "149585878290008367953146097709874651843"
}
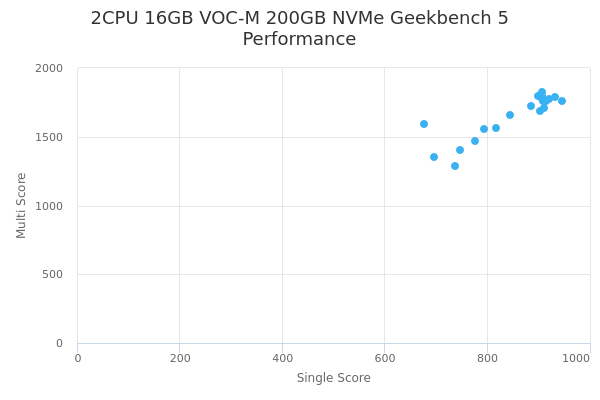
| Single | Multi | |
|---|---|---|
| Max | 946 | 1828 |
| Average | 852 | 1652 |
| Deviation | 82.30 | 158.88 |
| Min | 677 | 1291 |
Sign up as Freemium to get more insight.
- In same series
- 1CPU 8GB VOC-M 50GB NVMe
- 2CPU 16GB VOC-M 100GB NVMe
- 2CPU 16GB VOC-M 200GB NVMe
- 2CPU 16GB VOC-M 400GB NVMe
- 4CPU 32GB VOC-M 200GB NVMe
- 4CPU 32GB VOC-M 400GB NVMe
- 4CPU 32GB VOC-M 800GB NVMe
- 8CPU 64GB VOC-M 1600GB NVMe
- 8CPU 64GB VOC-M 400GB NVMe
- 8CPU 64GB VOC-M 800GB NVMe
- 16CPU 128GB VOC-M 1600GB NVMe
- 16CPU 128GB VOC-M 3200GB NVMe
- 16CPU 128GB VOC-M 800GB NVMe
- 24CPU 192GB VOC-M 1200GB NVMe
- 24CPU 192GB VOC-M 2400GB NVMe
- 24CPU 192GB VOC-M 4800GB NVMe
- 32CPU 256GB VOC-M 1600GB NVMe
- 32CPU 256GB VOC-M 3200GB NVMe