1CPU 2GB VHF 64GB NVMe by Vultr
Geekbench is a cross-platform processor benchmark with a scoring system that determines single-core and multi-core performance using loads simulating real-world scenarios. Geekbench 5 score is calculated with a reference score of 2500 representing the performance of the Intel Core i5-2520M @ 2.50 GHz. The software benchmark is available for Mac OS, Windows, Linux, Android and iOS platforms.
Specifications:
CPU
1
RAM
2.0 GB
Root
64 GB
1CPU 2GB VHF 64GB NVMe root
{
"configuration": {
"chart": {
"type": "scatter",
"polar": false,
"zoomType": "",
"options3d": {},
"height": null,
"width": null,
"margin": null,
"inverted": false,
"zooming": {}
},
"credits": {
"enabled": false
},
"title": {
"text": ""
},
"colorAxis": null,
"subtitle": {
"text": ""
},
"xAxis": {
"title": {
"text": [
"Single Score"
],
"useHTML": false,
"style": {
"color": "#666666"
}
},
"categories": null,
"lineWidth": 1,
"tickInterval": null,
"tickWidth": 1,
"tickLength": 10,
"tickPixelInterval": 100,
"plotLines": null,
"labels": {
"enabled": true,
"format": null,
"formatter": "",
"style": {
"color": "#666666",
"cursor": "default",
"fontSize": "11px"
},
"useHTML": false,
"step": 0
},
"plotBands": null,
"visible": true,
"floor": null,
"ceiling": null,
"type": "linear",
"min": 0,
"gridLineWidth": 1,
"gridLineColor": "#e6e6e6",
"minorTickInterval": null,
"minorTickWidth": 0,
"minTickInterval": null,
"startOnTick": true,
"endOnTick": true,
"tickmarkPlacement": 100,
"units": 100,
"minRange": 100
},
"yAxis": {
"title": {
"text": [
"Multi Score"
],
"useHTML": false,
"style": {
"color": "#666666"
}
},
"categories": null,
"plotLines": null,
"plotBands": null,
"lineWidth": null,
"tickInterval": null,
"tickLength": 10,
"floor": null,
"ceiling": null,
"gridLineInterpolation": null,
"gridLineWidth": 1,
"gridLineColor": "#e6e6e6",
"min": 0,
"max": null,
"minorTickInterval": null,
"minorTickWidth": 0,
"minTickInterval": null,
"startOnTick": true,
"endOnTick": true,
"minRange": null,
"type": "linear",
"tickmarkPlacement": null,
"labels": {
"enabled": true,
"formatter": null,
"style": {
"color": "#666666",
"cursor": "default",
"fontSize": "11px"
},
"useHTML": false
}
},
"zAxis": {
"title": {
"text": "Multi Score"
}
},
"plotOptions": {
"series": {
"dataLabels": {
"enabled": false,
"format": null,
"distance": 30,
"align": "center",
"inside": null,
"allowOverlap": false,
"style": {
"fontSize": "11px"
}
},
"showInLegend": null,
"turboThreshold": 0,
"stacking": "",
"groupPadding": 0.2,
"centerInCategory": false,
"findNearestPointBy": "x"
}
},
"navigator": {
"enabled": false
},
"scrollbar": {
"enabled": false
},
"rangeSelector": {
"enabled": false,
"inputEnabled": false
},
"legend": {
"enabled": null,
"maxHeight": null,
"align": "center",
"verticalAlign": "bottom",
"layout": "horizontal",
"width": null,
"margin": 12,
"reversed": false
},
"series": [
{
"name": "1CPU 2GB VHF 64GB NVMe by Vultr",
"color": "#3AB1F2",
"data": [
{
"x": 967.2327119448285,
"y": 968.7059161068617
},
{
"x": 943.8714479276557,
"y": 948.8526657558327
},
{
"x": 944.2664163427032,
"y": 938.1115998811715
},
{
"x": 944.1619605282935,
"y": 938.1853249955852
},
{
"x": 944.6290780549325,
"y": 957.7507141963695
},
{
"x": 950.8134999299939,
"y": 965.1401610933331
},
{
"x": 973.4482984964004,
"y": 978.4448116345721
},
{
"x": 970.5348764846522,
"y": 944.2635112544767
},
{
"x": 967.942314839331,
"y": 975.0663123103395
},
{
"x": 960.9527327069932,
"y": 968.7739405300016
},
{
"x": 949.4457961449264,
"y": 945.5118967952808
},
{
"x": 910.3541318390245,
"y": 921.3673230907009
},
{
"x": 950.4086725528398,
"y": 955.9290165519842
},
{
"x": 906.2359465983657,
"y": 888.6888612027094
},
{
"x": 954.6227828826857,
"y": 964.1812050180765
},
{
"x": 918.0053921785837,
"y": 923.1010923857932
},
{
"x": 952.2387339977136,
"y": 954.2378373425286
},
{
"x": 945.9154971834348,
"y": 895.2814994489064
},
{
"x": 943.7161376375101,
"y": 955.0963920606089
},
{
"x": 922.9457860656635,
"y": 950.8694554036744
}
]
}
],
"drilldown": {},
"tooltip": {
"enabled": true,
"useHTML": false,
"format": null,
"headerFormat": "",
"pointFormat": "<span style=\"color:{series.color}\">Single</span>: <b>{point.x:.0f}</b><br><span style=\"color:{series.color}\">Multi</span>: <b>{point.y:.0f}</b>",
"footerFormat": "",
"shared": false,
"outside": false,
"valueDecimals": null,
"split": false
},
"annotations": null
},
"hc_type": "chart",
"id": "177073425929943977645790019039418994655"
}
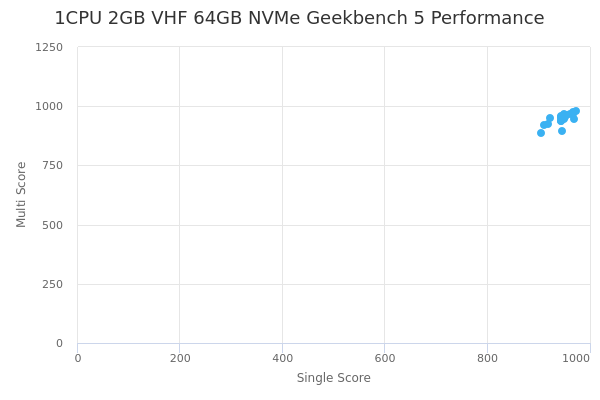
| Single | Multi | |
|---|---|---|
| Max | 973 | 978 |
| Average | 946 | 947 |
| Deviation | 18.53 | 23.61 |
| Min | 906 | 889 |
Sign up as Freemium to get more insight.