2CPU 2GB VHF 80GB NVMe by Vultr
Geekbench is a cross-platform processor benchmark with a scoring system that determines single-core and multi-core performance using loads simulating real-world scenarios. Geekbench 5 score is calculated with a reference score of 2500 representing the performance of the Intel Core i5-2520M @ 2.50 GHz. The software benchmark is available for Mac OS, Windows, Linux, Android and iOS platforms.
Specifications:
CPU
2
RAM
2.0 GB
Root
80 GB
2CPU 2GB VHF 80GB NVMe root
{
"configuration": {
"chart": {
"type": "scatter",
"polar": false,
"zoomType": "",
"options3d": {},
"height": null,
"width": null,
"margin": null,
"inverted": false,
"zooming": {}
},
"credits": {
"enabled": false
},
"title": {
"text": ""
},
"colorAxis": null,
"subtitle": {
"text": ""
},
"xAxis": {
"title": {
"text": [
"Single Score"
],
"useHTML": false,
"style": {
"color": "#666666"
}
},
"categories": null,
"lineWidth": 1,
"tickInterval": null,
"tickWidth": 1,
"tickLength": 10,
"tickPixelInterval": 100,
"plotLines": null,
"labels": {
"enabled": true,
"format": null,
"formatter": "",
"style": {
"color": "#666666",
"cursor": "default",
"fontSize": "11px"
},
"useHTML": false,
"step": 0
},
"plotBands": null,
"visible": true,
"floor": null,
"ceiling": null,
"type": "linear",
"min": 0,
"gridLineWidth": 1,
"gridLineColor": "#e6e6e6",
"minorTickInterval": null,
"minorTickWidth": 0,
"minTickInterval": null,
"startOnTick": true,
"endOnTick": true,
"tickmarkPlacement": 100,
"units": 100,
"minRange": 100
},
"yAxis": {
"title": {
"text": [
"Multi Score"
],
"useHTML": false,
"style": {
"color": "#666666"
}
},
"categories": null,
"plotLines": null,
"plotBands": null,
"lineWidth": null,
"tickInterval": null,
"tickLength": 10,
"floor": null,
"ceiling": null,
"gridLineInterpolation": null,
"gridLineWidth": 1,
"gridLineColor": "#e6e6e6",
"min": 0,
"max": null,
"minorTickInterval": null,
"minorTickWidth": 0,
"minTickInterval": null,
"startOnTick": true,
"endOnTick": true,
"minRange": null,
"type": "linear",
"tickmarkPlacement": null,
"labels": {
"enabled": true,
"formatter": null,
"style": {
"color": "#666666",
"cursor": "default",
"fontSize": "11px"
},
"useHTML": false
}
},
"zAxis": {
"title": {
"text": "Multi Score"
}
},
"plotOptions": {
"series": {
"dataLabels": {
"enabled": false,
"format": null,
"distance": 30,
"align": "center",
"inside": null,
"allowOverlap": false,
"style": {
"fontSize": "11px"
}
},
"showInLegend": null,
"turboThreshold": 0,
"stacking": "",
"groupPadding": 0.2,
"centerInCategory": false,
"findNearestPointBy": "x"
}
},
"navigator": {
"enabled": false
},
"scrollbar": {
"enabled": false
},
"rangeSelector": {
"enabled": false,
"inputEnabled": false
},
"legend": {
"enabled": null,
"maxHeight": null,
"align": "center",
"verticalAlign": "bottom",
"layout": "horizontal",
"width": null,
"margin": 12,
"reversed": false
},
"series": [
{
"name": "2CPU 2GB VHF 80GB NVMe by Vultr",
"color": "#3AB1F2",
"data": [
{
"x": 1177.1735665100864,
"y": 2182.6961703477978
},
{
"x": 1130.3537036399375,
"y": 2084.87301548698
},
{
"x": 1128.6105078584544,
"y": 2081.4259831178615
},
{
"x": 1127.8483449571536,
"y": 2184.665156728084
},
{
"x": 1151.426257523055,
"y": 2181.4742798604198
},
{
"x": 1111.3715913045348,
"y": 2129.816461661836
},
{
"x": 1182.9370325713421,
"y": 2222.8795839581435
},
{
"x": 1118.3597125853662,
"y": 2124.8933091586696
},
{
"x": 1168.1755288164077,
"y": 2236.2311486214116
},
{
"x": 1128.944132300698,
"y": 2122.179102215765
},
{
"x": 1190.2603990235002,
"y": 2225.384472411612
},
{
"x": 1140.5986670270577,
"y": 2392.011977181204
},
{
"x": 1164.12791902562,
"y": 2075.054918756393
},
{
"x": 1224.9374808393216,
"y": 2296.0430910853333
},
{
"x": 1158.153041577759,
"y": 2188.9591539002854
},
{
"x": 1209.139136319359,
"y": 2282.9773115301427
},
{
"x": 1176.8642039479228,
"y": 2032.4138971664802
},
{
"x": 1235.2365755500232,
"y": 2370.5471545227592
},
{
"x": 1221.3115392332718,
"y": 2322.359540711331
},
{
"x": 1118.0807532812053,
"y": 2103.5842103364857
}
]
}
],
"drilldown": {},
"tooltip": {
"enabled": true,
"useHTML": false,
"format": null,
"headerFormat": "",
"pointFormat": "<span style=\"color:{series.color}\">Single</span>: <b>{point.x:.0f}</b><br><span style=\"color:{series.color}\">Multi</span>: <b>{point.y:.0f}</b>",
"footerFormat": "",
"shared": false,
"outside": false,
"valueDecimals": null,
"split": false
},
"annotations": null
},
"hc_type": "chart",
"id": "233650702211428075238338496111278703833"
}
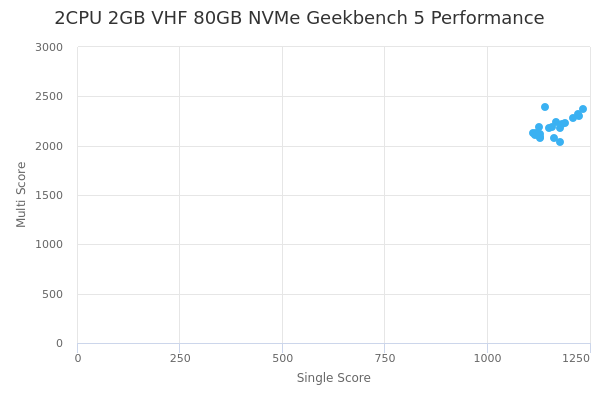
| Single | Multi | |
|---|---|---|
| Max | 1235 | 2392 |
| Average | 1163 | 2192 |
| Deviation | 37.50 | 99.04 |
| Min | 1111 | 2032 |
Sign up as Freemium to get more insight.