1CPU 1GB VHF 32GB NVMe by Vultr
Geekbench is a cross-platform processor benchmark with a scoring system that determines single-core and multi-core performance using loads simulating real-world scenarios. Geekbench 5 score is calculated with a reference score of 2500 representing the performance of the Intel Core i5-2520M @ 2.50 GHz. The software benchmark is available for Mac OS, Windows, Linux, Android and iOS platforms.
Specifications:
CPU
1
RAM
1.0 GB
Root
32 GB
1CPU 1GB VHF 32GB NVMe root
{
"configuration": {
"chart": {
"type": "scatter",
"polar": false,
"zoomType": "",
"options3d": {},
"height": null,
"width": null,
"margin": null,
"inverted": false,
"zooming": {}
},
"credits": {
"enabled": false
},
"title": {
"text": ""
},
"colorAxis": null,
"subtitle": {
"text": ""
},
"xAxis": {
"title": {
"text": [
"Single Score"
],
"useHTML": false,
"style": {
"color": "#666666"
}
},
"categories": null,
"lineWidth": 1,
"tickInterval": null,
"tickWidth": 1,
"tickLength": 10,
"tickPixelInterval": 100,
"plotLines": null,
"labels": {
"enabled": true,
"format": null,
"formatter": "",
"style": {
"color": "#666666",
"cursor": "default",
"fontSize": "11px"
},
"useHTML": false,
"step": 0
},
"plotBands": null,
"visible": true,
"floor": null,
"ceiling": null,
"type": "linear",
"min": 0,
"gridLineWidth": 1,
"gridLineColor": "#e6e6e6",
"minorTickInterval": null,
"minorTickWidth": 0,
"minTickInterval": null,
"startOnTick": true,
"endOnTick": true,
"tickmarkPlacement": 100,
"units": 100,
"minRange": 100
},
"yAxis": {
"title": {
"text": [
"Multi Score"
],
"useHTML": false,
"style": {
"color": "#666666"
}
},
"categories": null,
"plotLines": null,
"plotBands": null,
"lineWidth": null,
"tickInterval": null,
"tickLength": 10,
"floor": null,
"ceiling": null,
"gridLineInterpolation": null,
"gridLineWidth": 1,
"gridLineColor": "#e6e6e6",
"min": 0,
"max": null,
"minorTickInterval": null,
"minorTickWidth": 0,
"minTickInterval": null,
"startOnTick": true,
"endOnTick": true,
"minRange": null,
"type": "linear",
"tickmarkPlacement": null,
"labels": {
"enabled": true,
"formatter": null,
"style": {
"color": "#666666",
"cursor": "default",
"fontSize": "11px"
},
"useHTML": false
}
},
"zAxis": {
"title": {
"text": "Multi Score"
}
},
"plotOptions": {
"series": {
"dataLabels": {
"enabled": false,
"format": null,
"distance": 30,
"align": "center",
"inside": null,
"allowOverlap": false,
"style": {
"fontSize": "11px"
}
},
"showInLegend": null,
"turboThreshold": 0,
"stacking": "",
"groupPadding": 0.2,
"centerInCategory": false,
"findNearestPointBy": "x"
}
},
"navigator": {
"enabled": false
},
"scrollbar": {
"enabled": false
},
"rangeSelector": {
"enabled": false,
"inputEnabled": false
},
"legend": {
"enabled": null,
"maxHeight": null,
"align": "center",
"verticalAlign": "bottom",
"layout": "horizontal",
"width": null,
"margin": 12,
"reversed": false
},
"series": [
{
"name": "1CPU 1GB VHF 32GB NVMe by Vultr",
"color": "#3AB1F2",
"data": [
{
"x": 1003.2288117476392,
"y": 1005.9807534960362
},
{
"x": 974.4942208516056,
"y": 960.8428782383185
},
{
"x": 1014.0297459314197,
"y": 1012.0233419724565
},
{
"x": 979.5360695923005,
"y": 966.5804630705425
},
{
"x": 1016.5786703987908,
"y": 1014.3542887499955
},
{
"x": 922.8163285929284,
"y": 912.1764134243488
},
{
"x": 1014.5306755722339,
"y": 1012.1193075219533
},
{
"x": 899.5941118868328,
"y": 937.1261207419304
},
{
"x": 1012.8787947512335,
"y": 1008.624644053353
},
{
"x": 978.6259886736018,
"y": 977.3503167118226
},
{
"x": 1015.5935229817362,
"y": 1007.3727594833058
},
{
"x": 961.2315146954395,
"y": 933.3219961082439
},
{
"x": 1014.2607107371748,
"y": 1010.1822607678228
},
{
"x": 906.3414375239861,
"y": 891.7030887292897
},
{
"x": 1017.414055431316,
"y": 1009.0742111058206
},
{
"x": 898.3582173096434,
"y": 950.7448574539802
},
{
"x": 1016.8190931461622,
"y": 1012.006085483416
},
{
"x": 973.3969265685228,
"y": 967.5632762794925
},
{
"x": 1020.333797262612,
"y": 1003.8859854980215
},
{
"x": 961.8832337231698,
"y": 973.5543631230366
}
]
}
],
"drilldown": {},
"tooltip": {
"enabled": true,
"useHTML": false,
"format": null,
"headerFormat": "",
"pointFormat": "<span style=\"color:{series.color}\">Single</span>: <b>{point.x:.0f}</b><br><span style=\"color:{series.color}\">Multi</span>: <b>{point.y:.0f}</b>",
"footerFormat": "",
"shared": false,
"outside": false,
"valueDecimals": null,
"split": false
},
"annotations": null
},
"hc_type": "chart",
"id": "110435409220775263284057696180223790960"
}
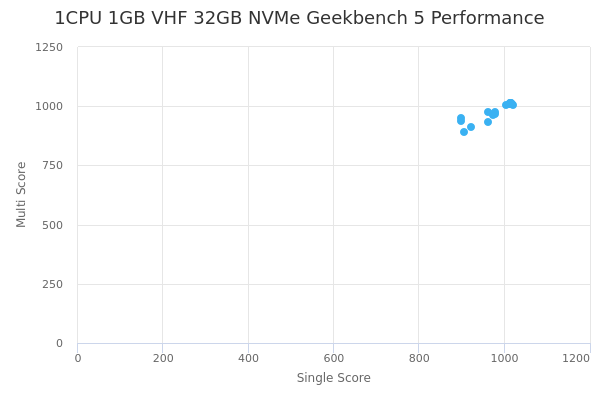
| Single | Multi | |
|---|---|---|
| Max | 1020 | 1014 |
| Average | 980 | 978 |
| Deviation | 41.66 | 36.60 |
| Min | 898 | 892 |
Sign up as Freemium to get more insight.