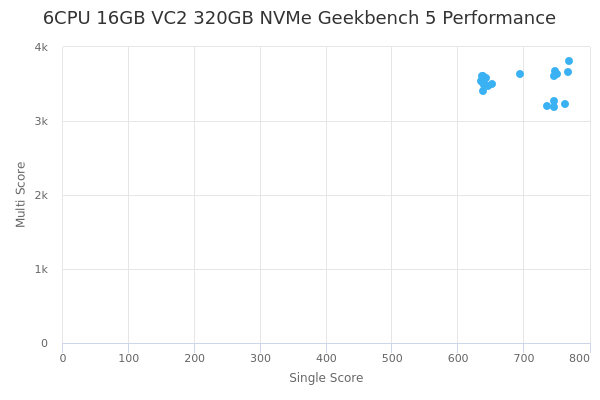
6CPU 16GB VC2 320GB NVMe by Vultr
Geekbench is a cross-platform processor benchmark with a scoring system that determines single-core and multi-core performance using loads simulating real-world scenarios. Geekbench 5 score is calculated with a reference score of 2500 representing the performance of the Intel Core i5-2520M @ 2.50 GHz. The software benchmark is available for Mac OS, Windows, Linux, Android and iOS platforms.
Specifications:
CPU
6
RAM
16.0 GB
Root
320 GB
6CPU 16GB VC2 320GB NVMe root
{
"configuration": {
"chart": {
"type": "scatter",
"polar": false,
"zoomType": "",
"options3d": {},
"height": null,
"width": null,
"margin": null,
"inverted": false,
"zooming": {}
},
"credits": {
"enabled": false
},
"title": {
"text": ""
},
"colorAxis": null,
"subtitle": {
"text": ""
},
"xAxis": {
"title": {
"text": [
"Single Score"
],
"useHTML": false,
"style": {
"color": "#666666"
}
},
"categories": null,
"lineWidth": 1,
"tickInterval": null,
"tickWidth": 1,
"tickLength": 10,
"tickPixelInterval": 100,
"plotLines": null,
"labels": {
"enabled": true,
"format": null,
"formatter": "",
"style": {
"color": "#666666",
"cursor": "default",
"fontSize": "11px"
},
"useHTML": false,
"step": 0
},
"plotBands": null,
"visible": true,
"floor": null,
"ceiling": null,
"type": "linear",
"min": 0,
"gridLineWidth": 1,
"gridLineColor": "#e6e6e6",
"minorTickInterval": null,
"minorTickWidth": 0,
"minTickInterval": null,
"startOnTick": true,
"endOnTick": true,
"tickmarkPlacement": 100,
"units": 100,
"minRange": 100
},
"yAxis": {
"title": {
"text": [
"Multi Score"
],
"useHTML": false,
"style": {
"color": "#666666"
}
},
"categories": null,
"plotLines": null,
"plotBands": null,
"lineWidth": null,
"tickInterval": null,
"tickLength": 10,
"floor": null,
"ceiling": null,
"gridLineInterpolation": null,
"gridLineWidth": 1,
"gridLineColor": "#e6e6e6",
"min": 0,
"max": null,
"minorTickInterval": null,
"minorTickWidth": 0,
"minTickInterval": null,
"startOnTick": true,
"endOnTick": true,
"minRange": null,
"type": "linear",
"tickmarkPlacement": null,
"labels": {
"enabled": true,
"formatter": null,
"style": {
"color": "#666666",
"cursor": "default",
"fontSize": "11px"
},
"useHTML": false
}
},
"zAxis": {
"title": {
"text": "Multi Score"
}
},
"plotOptions": {
"series": {
"dataLabels": {
"enabled": false,
"format": null,
"distance": 30,
"align": "center",
"inside": null,
"allowOverlap": false,
"style": {
"fontSize": "11px"
}
},
"showInLegend": null,
"turboThreshold": 0,
"stacking": "",
"groupPadding": 0.2,
"centerInCategory": false,
"findNearestPointBy": "x"
}
},
"navigator": {
"enabled": false
},
"scrollbar": {
"enabled": false
},
"rangeSelector": {
"enabled": false,
"inputEnabled": false
},
"legend": {
"enabled": null,
"maxHeight": null,
"align": "center",
"verticalAlign": "bottom",
"layout": "horizontal",
"width": null,
"margin": 12,
"reversed": false
},
"series": [
{
"name": "6CPU 16GB VC2 320GB NVMe by Vultr",
"color": "#3AB1F2",
"data": [
{
"x": 651.4339465549122,
"y": 3501.7227916156257
},
{
"x": 745.9236468596232,
"y": 3602.713511595718
},
{
"x": 646.4720574722388,
"y": 3473.3540415065054
},
{
"x": 750.0279361402839,
"y": 3637.377200484637
},
{
"x": 643.1399088885704,
"y": 3582.2553629946888
},
{
"x": 767.5242176919983,
"y": 3661.771051320934
},
{
"x": 638.7879511252954,
"y": 3603.0708880131087
},
{
"x": 768.7866434951783,
"y": 3805.471352103523
},
{
"x": 638.5698152969674,
"y": 3411.8333361183604
},
{
"x": 694.4667168659678,
"y": 3638.1821745761317
},
{
"x": 635.563271223086,
"y": 3545.04401022026
},
{
"x": 747.3260069636053,
"y": 3682.0379110820695
},
{
"x": 637.4129707219114,
"y": 3532.55403122959
},
{
"x": 762.9892244760592,
"y": 3229.028144882343
},
{
"x": 640.1132040125246,
"y": 3517.3154667429967
},
{
"x": 745.86982659221,
"y": 3264.24934555982
},
{
"x": 636.368448558171,
"y": 3611.7522002078586
},
{
"x": 735.9778667366538,
"y": 3207.311666463913
},
{
"x": 640.390915160094,
"y": 3490.9004560665744
},
{
"x": 746.6784466359676,
"y": 3191.0329110243692
}
]
}
],
"drilldown": {},
"tooltip": {
"enabled": true,
"useHTML": false,
"format": null,
"headerFormat": "",
"pointFormat": "<span style=\"color:{series.color}\">Single</span>: <b>{point.x:.0f}</b><br><span style=\"color:{series.color}\">Multi</span>: <b>{point.y:.0f}</b>",
"footerFormat": "",
"shared": false,
"outside": false,
"valueDecimals": null,
"split": false
},
"annotations": null
},
"hc_type": "chart",
"id": "233319162549416671093131631195147001244"
}
| Single | Multi | |
|---|---|---|
| Max | 769 | 3805 |
| Average | 694 | 3509 |
| Deviation | 54.84 | 166.03 |
| Min | 636 | 3191 |
Sign up as Freemium to get more insight.