8CPU 32GB VC2 640GB NVMe by Vultr
Geekbench is a cross-platform processor benchmark with a scoring system that determines single-core and multi-core performance using loads simulating real-world scenarios. Geekbench 5 score is calculated with a reference score of 2500 representing the performance of the Intel Core i5-2520M @ 2.50 GHz. The software benchmark is available for Mac OS, Windows, Linux, Android and iOS platforms.
Specifications:
CPU
8
RAM
32.0 GB
Root
640 GB
8CPU 32GB VC2 640GB NVMe root
{
"configuration": {
"chart": {
"type": "scatter",
"polar": false,
"zoomType": "",
"options3d": {},
"height": null,
"width": null,
"margin": null,
"inverted": false,
"zooming": {}
},
"credits": {
"enabled": false
},
"title": {
"text": ""
},
"colorAxis": null,
"subtitle": {
"text": ""
},
"xAxis": {
"title": {
"text": [
"Single Score"
],
"useHTML": false,
"style": {
"color": "#666666"
}
},
"categories": null,
"lineWidth": 1,
"tickInterval": null,
"tickWidth": 1,
"tickLength": 10,
"tickPixelInterval": 100,
"plotLines": null,
"labels": {
"enabled": true,
"format": null,
"formatter": "",
"style": {
"color": "#666666",
"cursor": "default",
"fontSize": "11px"
},
"useHTML": false,
"step": 0
},
"plotBands": null,
"visible": true,
"floor": null,
"ceiling": null,
"type": "linear",
"min": 0,
"gridLineWidth": 1,
"gridLineColor": "#e6e6e6",
"minorTickInterval": null,
"minorTickWidth": 0,
"minTickInterval": null,
"startOnTick": true,
"endOnTick": true,
"tickmarkPlacement": 100,
"units": 100,
"minRange": 100
},
"yAxis": {
"title": {
"text": [
"Multi Score"
],
"useHTML": false,
"style": {
"color": "#666666"
}
},
"categories": null,
"plotLines": null,
"plotBands": null,
"lineWidth": null,
"tickInterval": null,
"tickLength": 10,
"floor": null,
"ceiling": null,
"gridLineInterpolation": null,
"gridLineWidth": 1,
"gridLineColor": "#e6e6e6",
"min": 0,
"max": null,
"minorTickInterval": null,
"minorTickWidth": 0,
"minTickInterval": null,
"startOnTick": true,
"endOnTick": true,
"minRange": null,
"type": "linear",
"tickmarkPlacement": null,
"labels": {
"enabled": true,
"formatter": null,
"style": {
"color": "#666666",
"cursor": "default",
"fontSize": "11px"
},
"useHTML": false
}
},
"zAxis": {
"title": {
"text": "Multi Score"
}
},
"plotOptions": {
"series": {
"dataLabels": {
"enabled": false,
"format": null,
"distance": 30,
"align": "center",
"inside": null,
"allowOverlap": false,
"style": {
"fontSize": "11px"
}
},
"showInLegend": null,
"turboThreshold": 0,
"stacking": "",
"groupPadding": 0.2,
"centerInCategory": false,
"findNearestPointBy": "x"
}
},
"navigator": {
"enabled": false
},
"scrollbar": {
"enabled": false
},
"rangeSelector": {
"enabled": false,
"inputEnabled": false
},
"legend": {
"enabled": null,
"maxHeight": null,
"align": "center",
"verticalAlign": "bottom",
"layout": "horizontal",
"width": null,
"margin": 12,
"reversed": false
},
"series": [
{
"name": "8CPU 32GB VC2 640GB NVMe by Vultr",
"color": "#3AB1F2",
"data": [
{
"x": 563.8003210057813,
"y": 3411.580894177325
},
{
"x": 573.3862531366718,
"y": 3469.0512508631687
},
{
"x": 563.2432734521203,
"y": 3446.1220643419974
},
{
"x": 574.735570519793,
"y": 3203.4493003325424
},
{
"x": 567.3210363219192,
"y": 3653.4606472652404
},
{
"x": 561.742388089355,
"y": 3497.985090805234
},
{
"x": 568.7725996051779,
"y": 3554.540613976218
},
{
"x": 584.87212261336,
"y": 3209.0465957703664
},
{
"x": 572.146667914608,
"y": 3676.1582138029144
},
{
"x": 557.7208843477105,
"y": 3644.2710876430124
},
{
"x": 562.2855220709745,
"y": 3383.2355261895714
},
{
"x": 582.5698738130866,
"y": 3220.055340508724
},
{
"x": 901.333382607286,
"y": 6396.837007781511
},
{
"x": 882.613632504238,
"y": 6085.013982859216
},
{
"x": 902.3616456523689,
"y": 6171.939702278471
},
{
"x": 882.2248979411875,
"y": 6165.110544968498
},
{
"x": 901.8732726889572,
"y": 6545.232847717955
},
{
"x": 892.256308422791,
"y": 6183.168841548608
},
{
"x": 898.9166116502022,
"y": 6112.370407015437
},
{
"x": 872.6536344420199,
"y": 5968.460867070316
},
{
"x": 884.1654142329758,
"y": 5889.715473024064
},
{
"x": 886.4918212404206,
"y": 6089.458092800501
},
{
"x": 880.523210553569,
"y": 6360.406811537244
},
{
"x": 864.9737562599126,
"y": 6023.3513541748625
},
{
"x": 900.680231883687,
"y": 6031.041669764801
},
{
"x": 871.793572569131,
"y": 6104.375125871618
},
{
"x": 898.4330217925509,
"y": 6100.636561731267
},
{
"x": 870.498038878438,
"y": 5911.908842380362
},
{
"x": 909.2797945577072,
"y": 6179.383124882528
},
{
"x": 881.6604109874052,
"y": 6215.124320596063
},
{
"x": 893.2821311925344,
"y": 6291.687044968903
},
{
"x": 877.7546326833211,
"y": 6065.05743739225
}
]
}
],
"drilldown": {},
"tooltip": {
"enabled": true,
"useHTML": false,
"format": null,
"headerFormat": "",
"pointFormat": "<span style=\"color:{series.color}\">Single</span>: <b>{point.x:.0f}</b><br><span style=\"color:{series.color}\">Multi</span>: <b>{point.y:.0f}</b>",
"footerFormat": "",
"shared": false,
"outside": false,
"valueDecimals": null,
"split": false
},
"annotations": null
},
"hc_type": "chart",
"id": "331982621162383502956035773149504121176"
}
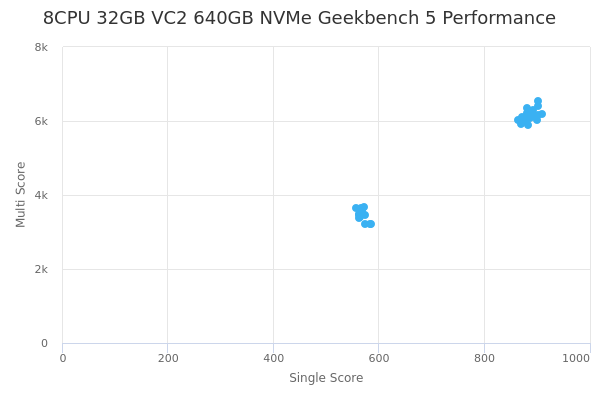
| Single | Multi | |
|---|---|---|
| Max | 909 | 6545 |
| Average | 768 | 5133 |
| Deviation | 154.49 | 1315.48 |
| Min | 558 | 3203 |
Sign up as Freemium to get more insight.