1CPU 2GB VC2 55GB NVMe by Vultr
Geekbench is a cross-platform processor benchmark with a scoring system that determines single-core and multi-core performance using loads simulating real-world scenarios. Geekbench 5 score is calculated with a reference score of 2500 representing the performance of the Intel Core i5-2520M @ 2.50 GHz. The software benchmark is available for Mac OS, Windows, Linux, Android and iOS platforms.
Specifications:
CPU
1
RAM
2.0 GB
Root
55 GB
1CPU 2GB VC2 55GB NVMe root
{
"configuration": {
"chart": {
"type": "scatter",
"polar": false,
"zoomType": "",
"options3d": {},
"height": null,
"width": null,
"margin": null,
"inverted": false,
"zooming": {}
},
"credits": {
"enabled": false
},
"title": {
"text": ""
},
"colorAxis": null,
"subtitle": {
"text": ""
},
"xAxis": {
"title": {
"text": [
"Single Score"
],
"useHTML": false,
"style": {
"color": "#666666"
}
},
"categories": null,
"lineWidth": 1,
"tickInterval": null,
"tickWidth": 1,
"tickLength": 10,
"tickPixelInterval": 100,
"plotLines": null,
"labels": {
"enabled": true,
"format": null,
"formatter": "",
"style": {
"color": "#666666",
"cursor": "default",
"fontSize": "11px"
},
"useHTML": false,
"step": 0
},
"plotBands": null,
"visible": true,
"floor": null,
"ceiling": null,
"type": "linear",
"min": 0,
"gridLineWidth": 1,
"gridLineColor": "#e6e6e6",
"minorTickInterval": null,
"minorTickWidth": 0,
"minTickInterval": null,
"startOnTick": true,
"endOnTick": true,
"tickmarkPlacement": 100,
"units": 100,
"minRange": 100
},
"yAxis": {
"title": {
"text": [
"Multi Score"
],
"useHTML": false,
"style": {
"color": "#666666"
}
},
"categories": null,
"plotLines": null,
"plotBands": null,
"lineWidth": null,
"tickInterval": null,
"tickLength": 10,
"floor": null,
"ceiling": null,
"gridLineInterpolation": null,
"gridLineWidth": 1,
"gridLineColor": "#e6e6e6",
"min": 0,
"max": null,
"minorTickInterval": null,
"minorTickWidth": 0,
"minTickInterval": null,
"startOnTick": true,
"endOnTick": true,
"minRange": null,
"type": "linear",
"tickmarkPlacement": null,
"labels": {
"enabled": true,
"formatter": null,
"style": {
"color": "#666666",
"cursor": "default",
"fontSize": "11px"
},
"useHTML": false
}
},
"zAxis": {
"title": {
"text": "Multi Score"
}
},
"plotOptions": {
"series": {
"dataLabels": {
"enabled": false,
"format": null,
"distance": 30,
"align": "center",
"inside": null,
"allowOverlap": false,
"style": {
"fontSize": "11px"
}
},
"showInLegend": null,
"turboThreshold": 0,
"stacking": "",
"groupPadding": 0.2,
"centerInCategory": false,
"findNearestPointBy": "x"
}
},
"navigator": {
"enabled": false
},
"scrollbar": {
"enabled": false
},
"rangeSelector": {
"enabled": false,
"inputEnabled": false
},
"legend": {
"enabled": null,
"maxHeight": null,
"align": "center",
"verticalAlign": "bottom",
"layout": "horizontal",
"width": null,
"margin": 12,
"reversed": false
},
"series": [
{
"name": "1CPU 2GB VC2 55GB NVMe by Vultr",
"color": "#3AB1F2",
"data": [
{
"x": 815.490946324713,
"y": 790.1463925745263
},
{
"x": 804.8318627007233,
"y": 805.7588488177114
},
{
"x": 781.9282908923112,
"y": 792.4107735557973
},
{
"x": 793.2338937051792,
"y": 798.0351596867515
},
{
"x": 809.0061831675993,
"y": 818.3160266355142
},
{
"x": 804.6750201347584,
"y": 787.3691413265312
},
{
"x": 770.0934378108973,
"y": 812.3912360506044
},
{
"x": 795.0711440661803,
"y": 799.387480211006
},
{
"x": 810.7560970323357,
"y": 814.7982232846698
},
{
"x": 814.0469785161438,
"y": 802.5702340201922
},
{
"x": 814.42867675753,
"y": 806.545679942675
},
{
"x": 790.3435627723842,
"y": 798.027512922407
},
{
"x": 797.5973809005343,
"y": 812.8674086947253
},
{
"x": 816.8592724934438,
"y": 802.5244672002395
},
{
"x": 829.7895329520397,
"y": 822.7430577312739
},
{
"x": 795.3644681235268,
"y": 808.272108852347
},
{
"x": 802.3440365530716,
"y": 790.2258418057254
},
{
"x": 806.6359299924488,
"y": 801.9098180901672
},
{
"x": 814.6170470675333,
"y": 838.9444669299515
},
{
"x": 804.0542374424142,
"y": 808.2703828572828
},
{
"x": 827.7308791343628,
"y": 820.4743002060868
},
{
"x": 808.1084299003119,
"y": 790.3256293027273
},
{
"x": 803.1670122235598,
"y": 796.5734104415785
},
{
"x": 799.5725668066084,
"y": 802.2981891410977
},
{
"x": 685.1104664303944,
"y": 699.6871564575175
},
{
"x": 808.8457063555355,
"y": 812.8415970386284
},
{
"x": 650.0836716100351,
"y": 681.5642710053258
},
{
"x": 806.8470417486711,
"y": 808.8087833699244
},
{
"x": 701.9450854447949,
"y": 695.0812010839678
},
{
"x": 800.8813013702081,
"y": 808.2098401816722
},
{
"x": 691.6418289676246,
"y": 717.6919865059219
},
{
"x": 802.212325739597,
"y": 814.1734879229888
},
{
"x": 685.913616869332,
"y": 717.119024769969
},
{
"x": 816.0017696237558,
"y": 813.5403779924762
},
{
"x": 703.3123029984832,
"y": 675.6847853776293
},
{
"x": 800.788561696735,
"y": 808.5064378887018
},
{
"x": 679.3491760488785,
"y": 735.1563861477744
},
{
"x": 808.1064584819376,
"y": 805.3487230699902
},
{
"x": 791.6140380692485,
"y": 809.64527230757
},
{
"x": 701.9903470305802,
"y": 700.8085078874188
},
{
"x": 821.4152435710937,
"y": 817.041010936604
},
{
"x": 705.004130533848,
"y": 690.584460621797
},
{
"x": 707.1103151110344,
"y": 687.3264863808848
}
]
}
],
"drilldown": {},
"tooltip": {
"enabled": true,
"useHTML": false,
"format": null,
"headerFormat": "",
"pointFormat": "<span style=\"color:{series.color}\">Single</span>: <b>{point.x:.0f}</b><br><span style=\"color:{series.color}\">Multi</span>: <b>{point.y:.0f}</b>",
"footerFormat": "",
"shared": false,
"outside": false,
"valueDecimals": null,
"split": false
},
"annotations": null
},
"hc_type": "chart",
"id": "33768755396442916006626394262487923503"
}
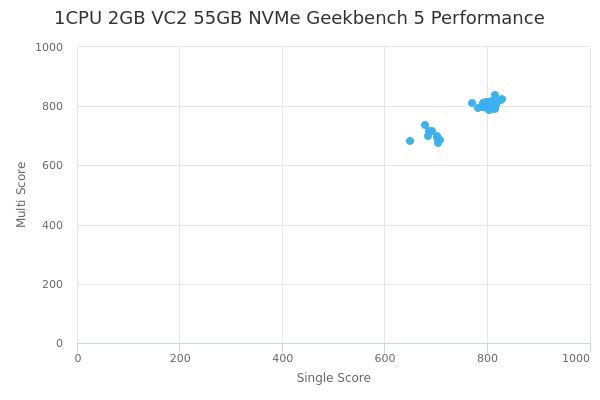
| Single | Multi | |
|---|---|---|
| Max | 830 | 839 |
| Average | 779 | 782 |
| Deviation | 49.89 | 46.76 |
| Min | 650 | 676 |
Sign up as Freemium to get more insight.