v3-standard-8 by VEXXHOST
Geekbench is a cross-platform processor benchmark with a scoring system that determines single-core and multi-core performance using loads simulating real-world scenarios. Geekbench 5 score is calculated with a reference score of 2500 representing the performance of the Intel Core i5-2520M @ 2.50 GHz. The software benchmark is available for Mac OS, Windows, Linux, Android and iOS platforms.
Specifications:
CPU
8
RAM
32.0 GB
Root
160 GB
Local root SSD v3
{
"configuration": {
"chart": {
"type": "scatter",
"polar": false,
"zoomType": "",
"options3d": {},
"height": null,
"width": null,
"margin": null,
"inverted": false,
"zooming": {}
},
"credits": {
"enabled": false
},
"title": {
"text": ""
},
"colorAxis": null,
"subtitle": {
"text": ""
},
"xAxis": {
"title": {
"text": [
"Single Score"
],
"useHTML": false,
"style": {
"color": "#666666"
}
},
"categories": null,
"lineWidth": 1,
"tickInterval": null,
"tickWidth": 1,
"tickLength": 10,
"tickPixelInterval": 100,
"plotLines": null,
"labels": {
"enabled": true,
"format": null,
"formatter": "",
"style": {
"color": "#666666",
"cursor": "default",
"fontSize": "11px"
},
"useHTML": false,
"step": 0
},
"plotBands": null,
"visible": true,
"floor": null,
"ceiling": null,
"type": "linear",
"min": 0,
"gridLineWidth": 1,
"gridLineColor": "#e6e6e6",
"minorTickInterval": null,
"minorTickWidth": 0,
"minTickInterval": null,
"startOnTick": true,
"endOnTick": true,
"tickmarkPlacement": 100,
"units": 100,
"minRange": 100
},
"yAxis": {
"title": {
"text": [
"Multi Score"
],
"useHTML": false,
"style": {
"color": "#666666"
}
},
"categories": null,
"plotLines": null,
"plotBands": null,
"lineWidth": null,
"tickInterval": null,
"tickLength": 10,
"floor": null,
"ceiling": null,
"gridLineInterpolation": null,
"gridLineWidth": 1,
"gridLineColor": "#e6e6e6",
"min": 0,
"max": null,
"minorTickInterval": null,
"minorTickWidth": 0,
"minTickInterval": null,
"startOnTick": true,
"endOnTick": true,
"minRange": null,
"type": "linear",
"tickmarkPlacement": null,
"labels": {
"enabled": true,
"formatter": null,
"style": {
"color": "#666666",
"cursor": "default",
"fontSize": "11px"
},
"useHTML": false
}
},
"zAxis": {
"title": {
"text": "Multi Score"
}
},
"plotOptions": {
"series": {
"dataLabels": {
"enabled": false,
"format": null,
"distance": 30,
"align": "center",
"inside": null,
"allowOverlap": false,
"style": {
"fontSize": "11px"
}
},
"showInLegend": null,
"turboThreshold": 0,
"stacking": "",
"groupPadding": 0.2,
"centerInCategory": false,
"findNearestPointBy": "x"
}
},
"navigator": {
"enabled": false
},
"scrollbar": {
"enabled": false
},
"rangeSelector": {
"enabled": false,
"inputEnabled": false
},
"legend": {
"enabled": null,
"maxHeight": null,
"align": "center",
"verticalAlign": "bottom",
"layout": "horizontal",
"width": null,
"margin": 12,
"reversed": false
},
"series": [
{
"name": "v3-standard-8 by VEXXHOST",
"color": "#6536FF",
"data": [
{
"x": 988.2022866770783,
"y": 6520.186929010753
},
{
"x": 987.7437567997517,
"y": 6653.985908510702
},
{
"x": 1006.1551078826708,
"y": 6619.949582813055
},
{
"x": 992.6327592525377,
"y": 6799.927266860042
},
{
"x": 1012.6733697990403,
"y": 6793.903400208868
},
{
"x": 997.4253150165905,
"y": 7002.645704737828
},
{
"x": 1007.9720056708421,
"y": 6896.860443358939
},
{
"x": 1004.1054582450665,
"y": 6946.859332203038
},
{
"x": 983.5439864989999,
"y": 6966.556839553916
},
{
"x": 997.7111028029537,
"y": 6954.315193197657
},
{
"x": 1000.0068989096394,
"y": 6987.7434281406295
},
{
"x": 1013.7149080362815,
"y": 7013.026591193804
},
{
"x": 1001.5410716678898,
"y": 6809.790362072809
},
{
"x": 1023.4966477537209,
"y": 7043.169425200417
},
{
"x": 1011.7200363997306,
"y": 6852.448756422291
},
{
"x": 1026.5325592562094,
"y": 6954.310990173167
},
{
"x": 996.7690668465298,
"y": 6729.1045711188335
},
{
"x": 1020.5520612149037,
"y": 6970.889658048056
},
{
"x": 1009.973531781859,
"y": 6872.104864092968
},
{
"x": 1018.9291406165976,
"y": 7002.437206914257
},
{
"x": 988.2973313188008,
"y": 6825.938718874863
},
{
"x": 962.7410655472182,
"y": 6652.942829461077
},
{
"x": 956.4779364708618,
"y": 6949.084457734483
},
{
"x": 948.8179305851122,
"y": 6796.16103213433
},
{
"x": 921.7792363548187,
"y": 6860.214178953547
},
{
"x": 939.0827712031632,
"y": 6831.9268188268325
},
{
"x": 940.6009228582354,
"y": 6938.51532549775
},
{
"x": 950.29490060344,
"y": 6768.038077575759
},
{
"x": 962.1060930138817,
"y": 7104.126165982169
},
{
"x": 964.8713670654956,
"y": 6836.096396332682
},
{
"x": 981.879173704257,
"y": 6916.1202787493885
},
{
"x": 966.4324957821398,
"y": 6692.01513969132
},
{
"x": 957.0692993997266,
"y": 6635.977133964087
},
{
"x": 936.6847952046774,
"y": 6799.125254396042
},
{
"x": 964.3643971910551,
"y": 6897.368512028797
},
{
"x": 964.8194901446657,
"y": 6828.903782485955
},
{
"x": 976.667758657933,
"y": 6816.525953311675
},
{
"x": 966.7230841892032,
"y": 6825.12651378539
},
{
"x": 918.1796799579195,
"y": 6820.476349358217
},
{
"x": 953.596691226498,
"y": 6880.790878324444
}
]
}
],
"drilldown": {},
"tooltip": {
"enabled": true,
"useHTML": false,
"format": null,
"headerFormat": "",
"pointFormat": "<span style=\"color:{series.color}\">Single</span>: <b>{point.x:.0f}</b><br><span style=\"color:{series.color}\">Multi</span>: <b>{point.y:.0f}</b>",
"footerFormat": "",
"shared": false,
"outside": false,
"valueDecimals": null,
"split": false
},
"annotations": null
},
"hc_type": "chart",
"id": "13435936899460037506006709121934125299"
}
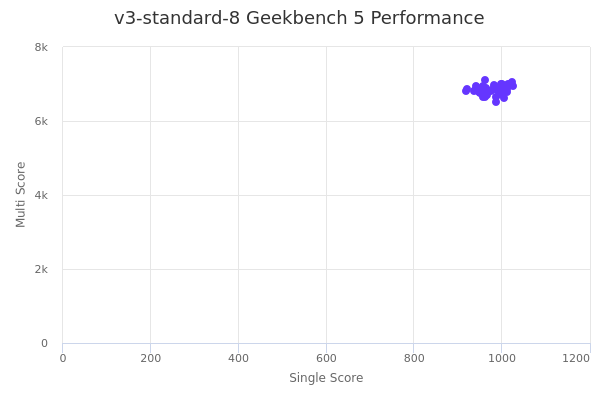
| Single | Multi | |
|---|---|---|
| Max | 1027 | 7104 |
| Average | 981 | 6852 |
| Deviation | 28.78 | 125.42 |
| Min | 918 | 6520 |
Sign up as Freemium to get more insight.