v3-standard-2 by VEXXHOST
Geekbench is a cross-platform processor benchmark with a scoring system that determines single-core and multi-core performance using loads simulating real-world scenarios. Geekbench 5 score is calculated with a reference score of 2500 representing the performance of the Intel Core i5-2520M @ 2.50 GHz. The software benchmark is available for Mac OS, Windows, Linux, Android and iOS platforms.
Specifications:
CPU
2
RAM
8.0 GB
Root
40 GB
Local root SSD v3
{
"configuration": {
"chart": {
"type": "scatter",
"polar": false,
"zoomType": "",
"options3d": {},
"height": null,
"width": null,
"margin": null,
"inverted": false,
"zooming": {}
},
"credits": {
"enabled": false
},
"title": {
"text": ""
},
"colorAxis": null,
"subtitle": {
"text": ""
},
"xAxis": {
"title": {
"text": [
"Single Score"
],
"useHTML": false,
"style": {
"color": "#666666"
}
},
"categories": null,
"lineWidth": 1,
"tickInterval": null,
"tickWidth": 1,
"tickLength": 10,
"tickPixelInterval": 100,
"plotLines": null,
"labels": {
"enabled": true,
"format": null,
"formatter": "",
"style": {
"color": "#666666",
"cursor": "default",
"fontSize": "11px"
},
"useHTML": false,
"step": 0
},
"plotBands": null,
"visible": true,
"floor": null,
"ceiling": null,
"type": "linear",
"min": 0,
"gridLineWidth": 1,
"gridLineColor": "#e6e6e6",
"minorTickInterval": null,
"minorTickWidth": 0,
"minTickInterval": null,
"startOnTick": true,
"endOnTick": true,
"tickmarkPlacement": 100,
"units": 100,
"minRange": 100
},
"yAxis": {
"title": {
"text": [
"Multi Score"
],
"useHTML": false,
"style": {
"color": "#666666"
}
},
"categories": null,
"plotLines": null,
"plotBands": null,
"lineWidth": null,
"tickInterval": null,
"tickLength": 10,
"floor": null,
"ceiling": null,
"gridLineInterpolation": null,
"gridLineWidth": 1,
"gridLineColor": "#e6e6e6",
"min": 0,
"max": null,
"minorTickInterval": null,
"minorTickWidth": 0,
"minTickInterval": null,
"startOnTick": true,
"endOnTick": true,
"minRange": null,
"type": "linear",
"tickmarkPlacement": null,
"labels": {
"enabled": true,
"formatter": null,
"style": {
"color": "#666666",
"cursor": "default",
"fontSize": "11px"
},
"useHTML": false
}
},
"zAxis": {
"title": {
"text": "Multi Score"
}
},
"plotOptions": {
"series": {
"dataLabels": {
"enabled": false,
"format": null,
"distance": 30,
"align": "center",
"inside": null,
"allowOverlap": false,
"style": {
"fontSize": "11px"
}
},
"showInLegend": null,
"turboThreshold": 0,
"stacking": "",
"groupPadding": 0.2,
"centerInCategory": false,
"findNearestPointBy": "x"
}
},
"navigator": {
"enabled": false
},
"scrollbar": {
"enabled": false
},
"rangeSelector": {
"enabled": false,
"inputEnabled": false
},
"legend": {
"enabled": null,
"maxHeight": null,
"align": "center",
"verticalAlign": "bottom",
"layout": "horizontal",
"width": null,
"margin": 12,
"reversed": false
},
"series": [
{
"name": "v3-standard-2 by VEXXHOST",
"color": "#6536FF",
"data": [
{
"x": 1007.1391901099345,
"y": 1962.4670603574982
},
{
"x": 1004.1266140142,
"y": 1962.3053417905508
},
{
"x": 1023.833067739737,
"y": 1953.5548650755259
},
{
"x": 1011.6012515794384,
"y": 1955.3734524961392
},
{
"x": 1007.9496340886876,
"y": 1967.3498571968921
},
{
"x": 1017.1844839700414,
"y": 1942.6375606862994
},
{
"x": 1003.5336745850987,
"y": 1969.1169701833333
},
{
"x": 1012.867154017782,
"y": 1971.1775787155675
},
{
"x": 1005.6117658924106,
"y": 1952.3009361819127
},
{
"x": 1019.1205395109819,
"y": 1969.66925659345
},
{
"x": 999.6571961548352,
"y": 1906.7975362474244
},
{
"x": 993.444025192642,
"y": 1888.3675438701603
},
{
"x": 1008.5622445372749,
"y": 1937.0340371084217
},
{
"x": 995.9895324918684,
"y": 1917.116792146628
},
{
"x": 1000.9171593864243,
"y": 1937.6054972345714
},
{
"x": 1008.7094447243271,
"y": 1932.488632686544
},
{
"x": 1008.5594384356874,
"y": 1912.99591576306
},
{
"x": 996.2650746867164,
"y": 1926.3435415792155
},
{
"x": 1006.5904582193026,
"y": 1921.3933210103867
},
{
"x": 996.2962792264138,
"y": 1903.545671648343
}
]
}
],
"drilldown": {},
"tooltip": {
"enabled": true,
"useHTML": false,
"format": null,
"headerFormat": "",
"pointFormat": "<span style=\"color:{series.color}\">Single</span>: <b>{point.x:.0f}</b><br><span style=\"color:{series.color}\">Multi</span>: <b>{point.y:.0f}</b>",
"footerFormat": "",
"shared": false,
"outside": false,
"valueDecimals": null,
"split": false
},
"annotations": null
},
"hc_type": "chart",
"id": "121180245401640560426413134928986006045"
}
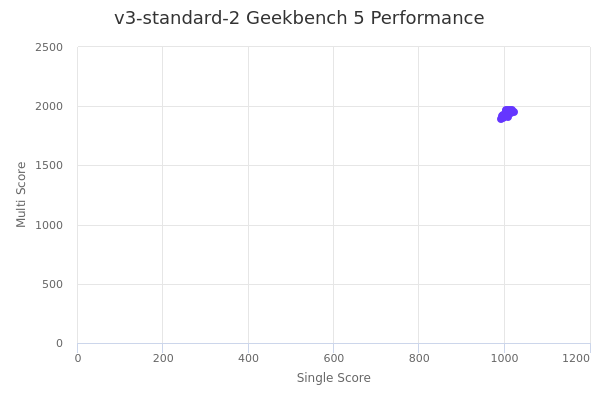
| Single | Multi | |
|---|---|---|
| Max | 1024 | 1971 |
| Average | 1006 | 1939 |
| Deviation | 7.87 | 24.47 |
| Min | 993 | 1888 |
Sign up as Freemium to get more insight.