v3-standard-16 by VEXXHOST
Geekbench is a cross-platform processor benchmark with a scoring system that determines single-core and multi-core performance using loads simulating real-world scenarios. Geekbench 5 score is calculated with a reference score of 2500 representing the performance of the Intel Core i5-2520M @ 2.50 GHz. The software benchmark is available for Mac OS, Windows, Linux, Android and iOS platforms.
Specifications:
CPU
16
RAM
64.0 GB
Root
320 GB
Local root SSD v3
{
"configuration": {
"chart": {
"type": "scatter",
"polar": false,
"zoomType": "",
"options3d": {},
"height": null,
"width": null,
"margin": null,
"inverted": false,
"zooming": {}
},
"credits": {
"enabled": false
},
"title": {
"text": ""
},
"colorAxis": null,
"subtitle": {
"text": ""
},
"xAxis": {
"title": {
"text": [
"Single Score"
],
"useHTML": false,
"style": {
"color": "#666666"
}
},
"categories": null,
"lineWidth": 1,
"tickInterval": null,
"tickWidth": 1,
"tickLength": 10,
"tickPixelInterval": 100,
"plotLines": null,
"labels": {
"enabled": true,
"format": null,
"formatter": "",
"style": {
"color": "#666666",
"cursor": "default",
"fontSize": "11px"
},
"useHTML": false,
"step": 0
},
"plotBands": null,
"visible": true,
"floor": null,
"ceiling": null,
"type": "linear",
"min": 0,
"gridLineWidth": 1,
"gridLineColor": "#e6e6e6",
"minorTickInterval": null,
"minorTickWidth": 0,
"minTickInterval": null,
"startOnTick": true,
"endOnTick": true,
"tickmarkPlacement": 100,
"units": 100,
"minRange": 100
},
"yAxis": {
"title": {
"text": [
"Multi Score"
],
"useHTML": false,
"style": {
"color": "#666666"
}
},
"categories": null,
"plotLines": null,
"plotBands": null,
"lineWidth": null,
"tickInterval": null,
"tickLength": 10,
"floor": null,
"ceiling": null,
"gridLineInterpolation": null,
"gridLineWidth": 1,
"gridLineColor": "#e6e6e6",
"min": 0,
"max": null,
"minorTickInterval": null,
"minorTickWidth": 0,
"minTickInterval": null,
"startOnTick": true,
"endOnTick": true,
"minRange": null,
"type": "linear",
"tickmarkPlacement": null,
"labels": {
"enabled": true,
"formatter": null,
"style": {
"color": "#666666",
"cursor": "default",
"fontSize": "11px"
},
"useHTML": false
}
},
"zAxis": {
"title": {
"text": "Multi Score"
}
},
"plotOptions": {
"series": {
"dataLabels": {
"enabled": false,
"format": null,
"distance": 30,
"align": "center",
"inside": null,
"allowOverlap": false,
"style": {
"fontSize": "11px"
}
},
"showInLegend": null,
"turboThreshold": 0,
"stacking": "",
"groupPadding": 0.2,
"centerInCategory": false,
"findNearestPointBy": "x"
}
},
"navigator": {
"enabled": false
},
"scrollbar": {
"enabled": false
},
"rangeSelector": {
"enabled": false,
"inputEnabled": false
},
"legend": {
"enabled": null,
"maxHeight": null,
"align": "center",
"verticalAlign": "bottom",
"layout": "horizontal",
"width": null,
"margin": 12,
"reversed": false
},
"series": [
{
"name": "v3-standard-16 by VEXXHOST",
"color": "#6536FF",
"data": [
{
"x": 978.7609991589845,
"y": 11130.565675692993
},
{
"x": 949.6999778691788,
"y": 9317.404468011107
},
{
"x": 956.7944277347144,
"y": 11695.430899719233
},
{
"x": 896.0657818615755,
"y": 9279.46806582075
},
{
"x": 965.7395252386975,
"y": 11714.048826304705
},
{
"x": 889.8557465537399,
"y": 9325.543494859323
},
{
"x": 966.8731764916092,
"y": 11965.720699033507
},
{
"x": 895.4627333172741,
"y": 9042.314709826014
},
{
"x": 921.0430202604925,
"y": 12141.649217684204
},
{
"x": 931.1495928962906,
"y": 9765.146071401281
},
{
"x": 958.0578293917922,
"y": 12645.027341834651
},
{
"x": 904.2994497456597,
"y": 9588.565261643049
},
{
"x": 960.48613606299,
"y": 12462.212754328084
},
{
"x": 887.7289156514039,
"y": 9595.510644589327
},
{
"x": 897.4858654516073,
"y": 12443.237182639192
},
{
"x": 909.7378598839514,
"y": 9586.070540235283
},
{
"x": 961.2086983047216,
"y": 12633.089905258652
},
{
"x": 941.2279359725177,
"y": 9724.67503860507
},
{
"x": 955.6071907374396,
"y": 12762.562038158121
},
{
"x": 923.5392953358928,
"y": 9738.527862299634
}
]
}
],
"drilldown": {},
"tooltip": {
"enabled": true,
"useHTML": false,
"format": null,
"headerFormat": "",
"pointFormat": "<span style=\"color:{series.color}\">Single</span>: <b>{point.x:.0f}</b><br><span style=\"color:{series.color}\">Multi</span>: <b>{point.y:.0f}</b>",
"footerFormat": "",
"shared": false,
"outside": false,
"valueDecimals": null,
"split": false
},
"annotations": null
},
"hc_type": "chart",
"id": "319868786058298574360147152847380519245"
}
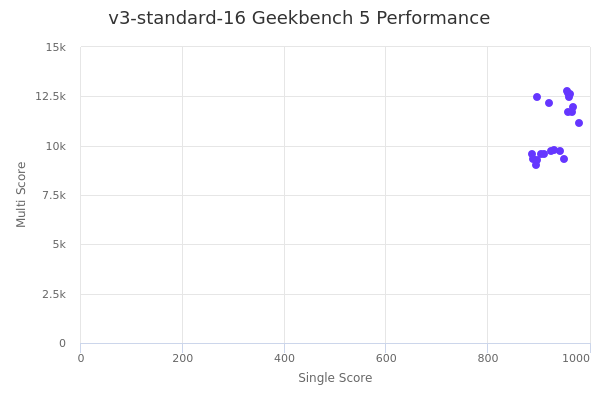
| Single | Multi | |
|---|---|---|
| Max | 979 | 12763 |
| Average | 933 | 10828 |
| Deviation | 29.55 | 1387.24 |
| Min | 888 | 9042 |
Sign up as Freemium to get more insight.