v3-standard-4 by VEXXHOST
Geekbench is a cross-platform processor benchmark with a scoring system that determines single-core and multi-core performance using loads simulating real-world scenarios. Geekbench 5 score is calculated with a reference score of 2500 representing the performance of the Intel Core i5-2520M @ 2.50 GHz. The software benchmark is available for Mac OS, Windows, Linux, Android and iOS platforms.
Specifications:
CPU
4
RAM
16.0 GB
Root
80 GB
Local root SSD v3
{
"configuration": {
"chart": {
"type": "scatter",
"polar": false,
"zoomType": "",
"options3d": {},
"height": null,
"width": null,
"margin": null,
"inverted": false,
"zooming": {}
},
"credits": {
"enabled": false
},
"title": {
"text": ""
},
"colorAxis": null,
"subtitle": {
"text": ""
},
"xAxis": {
"title": {
"text": [
"Single Score"
],
"useHTML": false,
"style": {
"color": "#666666"
}
},
"categories": null,
"lineWidth": 1,
"tickInterval": null,
"tickWidth": 1,
"tickLength": 10,
"tickPixelInterval": 100,
"plotLines": null,
"labels": {
"enabled": true,
"format": null,
"formatter": "",
"style": {
"color": "#666666",
"cursor": "default",
"fontSize": "11px"
},
"useHTML": false,
"step": 0
},
"plotBands": null,
"visible": true,
"floor": null,
"ceiling": null,
"type": "linear",
"min": 0,
"gridLineWidth": 1,
"gridLineColor": "#e6e6e6",
"minorTickInterval": null,
"minorTickWidth": 0,
"minTickInterval": null,
"startOnTick": true,
"endOnTick": true,
"tickmarkPlacement": 100,
"units": 100,
"minRange": 100
},
"yAxis": {
"title": {
"text": [
"Multi Score"
],
"useHTML": false,
"style": {
"color": "#666666"
}
},
"categories": null,
"plotLines": null,
"plotBands": null,
"lineWidth": null,
"tickInterval": null,
"tickLength": 10,
"floor": null,
"ceiling": null,
"gridLineInterpolation": null,
"gridLineWidth": 1,
"gridLineColor": "#e6e6e6",
"min": 0,
"max": null,
"minorTickInterval": null,
"minorTickWidth": 0,
"minTickInterval": null,
"startOnTick": true,
"endOnTick": true,
"minRange": null,
"type": "linear",
"tickmarkPlacement": null,
"labels": {
"enabled": true,
"formatter": null,
"style": {
"color": "#666666",
"cursor": "default",
"fontSize": "11px"
},
"useHTML": false
}
},
"zAxis": {
"title": {
"text": "Multi Score"
}
},
"plotOptions": {
"series": {
"dataLabels": {
"enabled": false,
"format": null,
"distance": 30,
"align": "center",
"inside": null,
"allowOverlap": false,
"style": {
"fontSize": "11px"
}
},
"showInLegend": null,
"turboThreshold": 0,
"stacking": "",
"groupPadding": 0.2,
"centerInCategory": false,
"findNearestPointBy": "x"
}
},
"navigator": {
"enabled": false
},
"scrollbar": {
"enabled": false
},
"rangeSelector": {
"enabled": false,
"inputEnabled": false
},
"legend": {
"enabled": null,
"maxHeight": null,
"align": "center",
"verticalAlign": "bottom",
"layout": "horizontal",
"width": null,
"margin": 12,
"reversed": false
},
"series": [
{
"name": "v3-standard-4 by VEXXHOST",
"color": "#6536FF",
"data": [
{
"x": 1020.7138446316728,
"y": 3623.5319900409686
},
{
"x": 990.6975591293457,
"y": 3622.500816951021
},
{
"x": 1013.8878643286193,
"y": 3761.9097636071733
},
{
"x": 986.9983024201888,
"y": 3529.0451605891585
},
{
"x": 1022.9146659570351,
"y": 3788.551321979242
},
{
"x": 989.4684894793538,
"y": 3486.1552021112375
},
{
"x": 1018.1684207455168,
"y": 3714.148695281592
},
{
"x": 984.7382108237948,
"y": 3495.2003508844064
},
{
"x": 1023.5515985561765,
"y": 3772.4211193876545
},
{
"x": 994.0497822529577,
"y": 3460.653167893466
},
{
"x": 1005.7946235058298,
"y": 3747.363237601932
},
{
"x": 1002.7567812081585,
"y": 3681.9602517626413
},
{
"x": 1025.4467870622832,
"y": 3795.281517902402
},
{
"x": 1009.8399876032687,
"y": 3777.984515395575
},
{
"x": 1020.1249869696303,
"y": 3792.8006522880296
},
{
"x": 1016.3080707417168,
"y": 3728.1774194713
},
{
"x": 1017.9329799486084,
"y": 3707.3308979344756
},
{
"x": 1021.8563628080417,
"y": 3752.5505598398076
},
{
"x": 1014.7868442224458,
"y": 3692.5564479548093
},
{
"x": 1022.1070436734241,
"y": 3732.4080354319553
}
]
}
],
"drilldown": {},
"tooltip": {
"enabled": true,
"useHTML": false,
"format": null,
"headerFormat": "",
"pointFormat": "<span style=\"color:{series.color}\">Single</span>: <b>{point.x:.0f}</b><br><span style=\"color:{series.color}\">Multi</span>: <b>{point.y:.0f}</b>",
"footerFormat": "",
"shared": false,
"outside": false,
"valueDecimals": null,
"split": false
},
"annotations": null
},
"hc_type": "chart",
"id": "231735133144479010005849700007592534989"
}
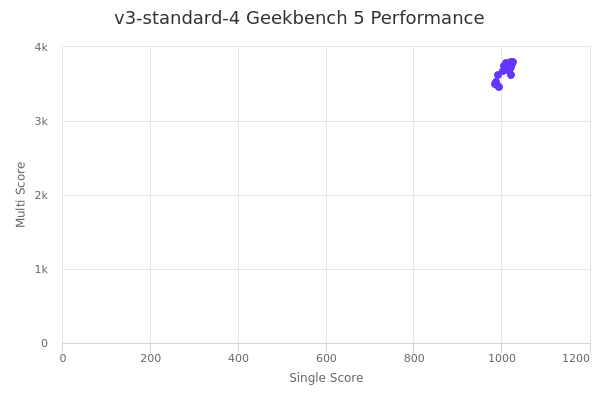
| Single | Multi | |
|---|---|---|
| Max | 1025 | 3795 |
| Average | 1010 | 3683 |
| Deviation | 13.39 | 106.89 |
| Min | 985 | 3461 |
Sign up as Freemium to get more insight.