HIMEM-2xCPU-16GB by UpCloud
Geekbench is a cross-platform processor benchmark with a scoring system that determines single-core and multi-core performance using loads simulating real-world scenarios. Geekbench 5 score is calculated with a reference score of 2500 representing the performance of the Intel Core i5-2520M @ 2.50 GHz. The software benchmark is available for Mac OS, Windows, Linux, Android and iOS platforms.
Specifications:
CPU
2
RAM
16.0 GB
Root
100 GB
Root HIMEM-2xCPU-16GB MaxIOPS
{
"configuration": {
"chart": {
"type": "scatter",
"polar": false,
"zoomType": "",
"options3d": {},
"height": null,
"width": null,
"margin": null,
"inverted": false,
"zooming": {}
},
"credits": {
"enabled": false
},
"title": {
"text": ""
},
"colorAxis": null,
"subtitle": {
"text": ""
},
"xAxis": {
"title": {
"text": [
"Single Score"
],
"useHTML": false,
"style": {
"color": "#666666"
}
},
"categories": null,
"lineWidth": 1,
"tickInterval": null,
"tickWidth": 1,
"tickLength": 10,
"tickPixelInterval": 100,
"plotLines": null,
"labels": {
"enabled": true,
"format": null,
"formatter": "",
"style": {
"color": "#666666",
"cursor": "default",
"fontSize": "11px"
},
"useHTML": false,
"step": 0
},
"plotBands": null,
"visible": true,
"floor": null,
"ceiling": null,
"type": "linear",
"min": 0,
"gridLineWidth": 1,
"gridLineColor": "#e6e6e6",
"minorTickInterval": null,
"minorTickWidth": 0,
"minTickInterval": null,
"startOnTick": true,
"endOnTick": true,
"tickmarkPlacement": 100,
"units": 100,
"minRange": 100
},
"yAxis": {
"title": {
"text": [
"Multi Score"
],
"useHTML": false,
"style": {
"color": "#666666"
}
},
"categories": null,
"plotLines": null,
"plotBands": null,
"lineWidth": null,
"tickInterval": null,
"tickLength": 10,
"floor": null,
"ceiling": null,
"gridLineInterpolation": null,
"gridLineWidth": 1,
"gridLineColor": "#e6e6e6",
"min": 0,
"max": null,
"minorTickInterval": null,
"minorTickWidth": 0,
"minTickInterval": null,
"startOnTick": true,
"endOnTick": true,
"minRange": null,
"type": "linear",
"tickmarkPlacement": null,
"labels": {
"enabled": true,
"formatter": null,
"style": {
"color": "#666666",
"cursor": "default",
"fontSize": "11px"
},
"useHTML": false
}
},
"zAxis": {
"title": {
"text": "Multi Score"
}
},
"plotOptions": {
"series": {
"dataLabels": {
"enabled": false,
"format": null,
"distance": 30,
"align": "center",
"inside": null,
"allowOverlap": false,
"style": {
"fontSize": "11px"
}
},
"showInLegend": null,
"turboThreshold": 0,
"stacking": "",
"groupPadding": 0.2,
"centerInCategory": false,
"findNearestPointBy": "x"
}
},
"navigator": {
"enabled": false
},
"scrollbar": {
"enabled": false
},
"rangeSelector": {
"enabled": false,
"inputEnabled": false
},
"legend": {
"enabled": null,
"maxHeight": null,
"align": "center",
"verticalAlign": "bottom",
"layout": "horizontal",
"width": null,
"margin": 12,
"reversed": false
},
"series": [
{
"name": "HIMEM-2xCPU-16GB by UpCloud",
"color": "#8b00ff",
"data": [
{
"x": 872.8103515503926,
"y": 1668.9750362813445
},
{
"x": 850.7290137047299,
"y": 1613.291897209816
},
{
"x": 845.1204836203237,
"y": 1637.04206688311
},
{
"x": 868.8673760050374,
"y": 1633.5503318038354
},
{
"x": 868.0935777958721,
"y": 1648.704868792291
},
{
"x": 864.1796640272012,
"y": 1591.6446321303156
},
{
"x": 872.1034931257199,
"y": 1657.982779370082
},
{
"x": 855.9524789200673,
"y": 1619.8614608039927
},
{
"x": 868.9738598470835,
"y": 1637.955255949509
},
{
"x": 871.3414055535932,
"y": 1634.0141794577462
},
{
"x": 853.7484143464673,
"y": 1662.6704551062398
},
{
"x": 872.2106278749532,
"y": 1653.8453632160104
},
{
"x": 864.1451596444615,
"y": 1652.3808862102915
},
{
"x": 870.1427872429126,
"y": 1632.2746195580517
},
{
"x": 877.467555242014,
"y": 1679.16997451139
},
{
"x": 867.8717845901651,
"y": 1637.3505723755286
},
{
"x": 864.0313186317239,
"y": 1597.3210001280406
},
{
"x": 861.5613538980085,
"y": 1625.9124494740777
},
{
"x": 823.0809328768664,
"y": 1630.6471378626188
},
{
"x": 844.1484412226421,
"y": 1249.817839246011
}
]
}
],
"drilldown": {},
"tooltip": {
"enabled": true,
"useHTML": false,
"format": null,
"headerFormat": "",
"pointFormat": "<span style=\"color:{series.color}\">Single</span>: <b>{point.x:.0f}</b><br><span style=\"color:{series.color}\">Multi</span>: <b>{point.y:.0f}</b>",
"footerFormat": "",
"shared": false,
"outside": false,
"valueDecimals": null,
"split": false
},
"annotations": null
},
"hc_type": "chart",
"id": "74669609115030956005423811865522849511"
}
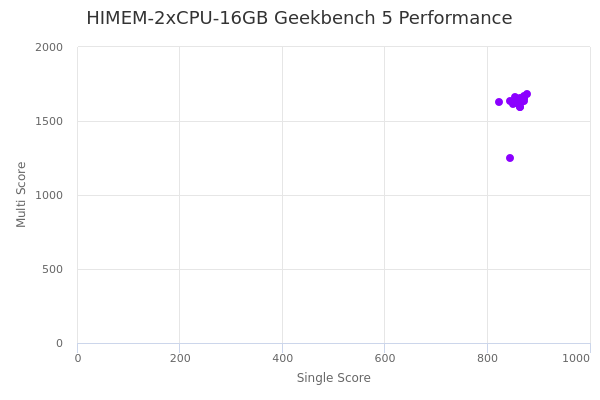
| Single | Multi | |
|---|---|---|
| Max | 877 | 1679 |
| Average | 862 | 1618 |
| Deviation | 12.74 | 87.21 |
| Min | 823 | 1250 |
Sign up as Freemium to get more insight.