HIMEM-8xCPU-192GB by UpCloud
Geekbench is a cross-platform processor benchmark with a scoring system that determines single-core and multi-core performance using loads simulating real-world scenarios. Geekbench 5 score is calculated with a reference score of 2500 representing the performance of the Intel Core i5-2520M @ 2.50 GHz. The software benchmark is available for Mac OS, Windows, Linux, Android and iOS platforms.
Specifications:
CPU
8
RAM
192.0 GB
Root
400 GB
Root HIMEM-8xCPU-192GB MaxIOPS
{
"configuration": {
"chart": {
"type": "scatter",
"polar": false,
"zoomType": "",
"options3d": {},
"height": null,
"width": null,
"margin": null,
"inverted": false,
"zooming": {}
},
"credits": {
"enabled": false
},
"title": {
"text": ""
},
"colorAxis": null,
"subtitle": {
"text": ""
},
"xAxis": {
"title": {
"text": [
"Single Score"
],
"useHTML": false,
"style": {
"color": "#666666"
}
},
"categories": null,
"lineWidth": 1,
"tickInterval": null,
"tickWidth": 1,
"tickLength": 10,
"tickPixelInterval": 100,
"plotLines": null,
"labels": {
"enabled": true,
"format": null,
"formatter": "",
"style": {
"color": "#666666",
"cursor": "default",
"fontSize": "11px"
},
"useHTML": false,
"step": 0
},
"plotBands": null,
"visible": true,
"floor": null,
"ceiling": null,
"type": "linear",
"min": 0,
"gridLineWidth": 1,
"gridLineColor": "#e6e6e6",
"minorTickInterval": null,
"minorTickWidth": 0,
"minTickInterval": null,
"startOnTick": true,
"endOnTick": true,
"tickmarkPlacement": 100,
"units": 100,
"minRange": 100
},
"yAxis": {
"title": {
"text": [
"Multi Score"
],
"useHTML": false,
"style": {
"color": "#666666"
}
},
"categories": null,
"plotLines": null,
"plotBands": null,
"lineWidth": null,
"tickInterval": null,
"tickLength": 10,
"floor": null,
"ceiling": null,
"gridLineInterpolation": null,
"gridLineWidth": 1,
"gridLineColor": "#e6e6e6",
"min": 0,
"max": null,
"minorTickInterval": null,
"minorTickWidth": 0,
"minTickInterval": null,
"startOnTick": true,
"endOnTick": true,
"minRange": null,
"type": "linear",
"tickmarkPlacement": null,
"labels": {
"enabled": true,
"formatter": null,
"style": {
"color": "#666666",
"cursor": "default",
"fontSize": "11px"
},
"useHTML": false
}
},
"zAxis": {
"title": {
"text": "Multi Score"
}
},
"plotOptions": {
"series": {
"dataLabels": {
"enabled": false,
"format": null,
"distance": 30,
"align": "center",
"inside": null,
"allowOverlap": false,
"style": {
"fontSize": "11px"
}
},
"showInLegend": null,
"turboThreshold": 0,
"stacking": "",
"groupPadding": 0.2,
"centerInCategory": false,
"findNearestPointBy": "x"
}
},
"navigator": {
"enabled": false
},
"scrollbar": {
"enabled": false
},
"rangeSelector": {
"enabled": false,
"inputEnabled": false
},
"legend": {
"enabled": null,
"maxHeight": null,
"align": "center",
"verticalAlign": "bottom",
"layout": "horizontal",
"width": null,
"margin": 12,
"reversed": false
},
"series": [
{
"name": "HIMEM-8xCPU-192GB by UpCloud",
"color": "#8b00ff",
"data": [
{
"x": 919.4150815827832,
"y": 6365.818985139578
},
{
"x": 923.6567745724856,
"y": 5934.84978957842
},
{
"x": 909.7480560410885,
"y": 5856.639818321917
},
{
"x": 926.0362613482987,
"y": 5947.762696529906
},
{
"x": 919.2638602034654,
"y": 6084.6137879365415
},
{
"x": 916.7791707073686,
"y": 6320.220209543195
},
{
"x": 929.9068481068139,
"y": 6133.224091246672
},
{
"x": 933.6574308689633,
"y": 5995.1124333512735
},
{
"x": 927.6830005258767,
"y": 6344.1407917080105
},
{
"x": 941.7854814692016,
"y": 6481.180710851974
},
{
"x": 1133.9110804859333,
"y": 8064.683182501712
},
{
"x": 1084.3785714300295,
"y": 8179.085734456614
},
{
"x": 1112.228245352755,
"y": 7837.306775657166
},
{
"x": 1118.81632254249,
"y": 7816.680747623814
},
{
"x": 1126.6778411036498,
"y": 8117.939496374742
},
{
"x": 1103.0623874025962,
"y": 7918.9195716694085
},
{
"x": 1115.6354610355752,
"y": 7968.659304325542
},
{
"x": 1128.1568975552275,
"y": 8138.730935379534
},
{
"x": 1115.2284979930537,
"y": 8169.032749429346
},
{
"x": 1088.6949164490952,
"y": 7611.943927171367
},
{
"x": 1115.6012798147863,
"y": 8071.295138703472
},
{
"x": 1099.6450334917895,
"y": 5588.158492375605
},
{
"x": 1109.8005585323285,
"y": 7963.7651050626155
},
{
"x": 1115.8239231304185,
"y": 5510.099334477505
},
{
"x": 1107.9903592521205,
"y": 8024.811829505974
},
{
"x": 1115.8465214397704,
"y": 5733.437239981743
},
{
"x": 1127.4105990223566,
"y": 7935.152178232322
},
{
"x": 1103.4497866190525,
"y": 5545.228399628279
},
{
"x": 1112.502259387144,
"y": 5826.7875909710765
},
{
"x": 1115.7148498589681,
"y": 5686.543146720463
}
]
}
],
"drilldown": {},
"tooltip": {
"enabled": true,
"useHTML": false,
"format": null,
"headerFormat": "",
"pointFormat": "<span style=\"color:{series.color}\">Single</span>: <b>{point.x:.0f}</b><br><span style=\"color:{series.color}\">Multi</span>: <b>{point.y:.0f}</b>",
"footerFormat": "",
"shared": false,
"outside": false,
"valueDecimals": null,
"split": false
},
"annotations": null
},
"hc_type": "chart",
"id": "151009313520515338567171683438552452002"
}
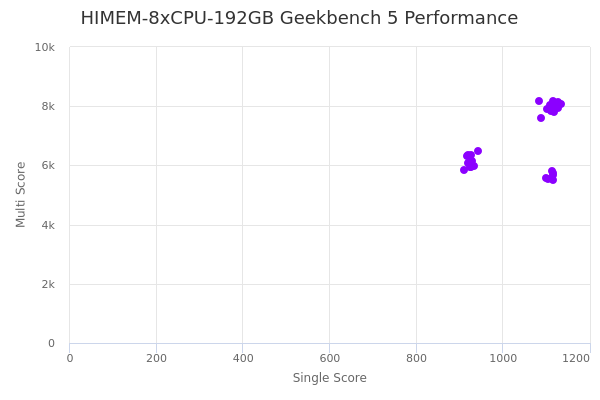
| Single | Multi | |
|---|---|---|
| Max | 1134 | 8179 |
| Average | 1050 | 6906 |
| Deviation | 89.19 | 1039.93 |
| Min | 910 | 5510 |
Sign up as Freemium to get more insight.