HIMEM-2xCPU-8GB by UpCloud
Geekbench is a cross-platform processor benchmark with a scoring system that determines single-core and multi-core performance using loads simulating real-world scenarios. Geekbench 5 score is calculated with a reference score of 2500 representing the performance of the Intel Core i5-2520M @ 2.50 GHz. The software benchmark is available for Mac OS, Windows, Linux, Android and iOS platforms.
Specifications:
CPU
2
RAM
8.0 GB
Root
100 GB
Root HIMEM-2xCPU-8GB MaxIOPS
{
"configuration": {
"chart": {
"type": "scatter",
"polar": false,
"zoomType": "",
"options3d": {},
"height": null,
"width": null,
"margin": null,
"inverted": false,
"zooming": {}
},
"credits": {
"enabled": false
},
"title": {
"text": ""
},
"colorAxis": null,
"subtitle": {
"text": ""
},
"xAxis": {
"title": {
"text": [
"Single Score"
],
"useHTML": false,
"style": {
"color": "#666666"
}
},
"categories": null,
"lineWidth": 1,
"tickInterval": null,
"tickWidth": 1,
"tickLength": 10,
"tickPixelInterval": 100,
"plotLines": null,
"labels": {
"enabled": true,
"format": null,
"formatter": "",
"style": {
"color": "#666666",
"cursor": "default",
"fontSize": "11px"
},
"useHTML": false,
"step": 0
},
"plotBands": null,
"visible": true,
"floor": null,
"ceiling": null,
"type": "linear",
"min": 0,
"gridLineWidth": 1,
"gridLineColor": "#e6e6e6",
"minorTickInterval": null,
"minorTickWidth": 0,
"minTickInterval": null,
"startOnTick": true,
"endOnTick": true,
"tickmarkPlacement": 100,
"units": 100,
"minRange": 100
},
"yAxis": {
"title": {
"text": [
"Multi Score"
],
"useHTML": false,
"style": {
"color": "#666666"
}
},
"categories": null,
"plotLines": null,
"plotBands": null,
"lineWidth": null,
"tickInterval": null,
"tickLength": 10,
"floor": null,
"ceiling": null,
"gridLineInterpolation": null,
"gridLineWidth": 1,
"gridLineColor": "#e6e6e6",
"min": 0,
"max": null,
"minorTickInterval": null,
"minorTickWidth": 0,
"minTickInterval": null,
"startOnTick": true,
"endOnTick": true,
"minRange": null,
"type": "linear",
"tickmarkPlacement": null,
"labels": {
"enabled": true,
"formatter": null,
"style": {
"color": "#666666",
"cursor": "default",
"fontSize": "11px"
},
"useHTML": false
}
},
"zAxis": {
"title": {
"text": "Multi Score"
}
},
"plotOptions": {
"series": {
"dataLabels": {
"enabled": false,
"format": null,
"distance": 30,
"align": "center",
"inside": null,
"allowOverlap": false,
"style": {
"fontSize": "11px"
}
},
"showInLegend": null,
"turboThreshold": 0,
"stacking": "",
"groupPadding": 0.2,
"centerInCategory": false,
"findNearestPointBy": "x"
}
},
"navigator": {
"enabled": false
},
"scrollbar": {
"enabled": false
},
"rangeSelector": {
"enabled": false,
"inputEnabled": false
},
"legend": {
"enabled": null,
"maxHeight": null,
"align": "center",
"verticalAlign": "bottom",
"layout": "horizontal",
"width": null,
"margin": 12,
"reversed": false
},
"series": [
{
"name": "HIMEM-2xCPU-8GB by UpCloud",
"color": "#8b00ff",
"data": [
{
"x": 879.6417719712641,
"y": 1697.712565241847
},
{
"x": 881.59377207459,
"y": 977.2592103496181
},
{
"x": 905.1728433783471,
"y": 1725.5985003624028
},
{
"x": 869.254833772437,
"y": 988.9391916758752
},
{
"x": 883.2177322189325,
"y": 1747.3799468513057
},
{
"x": 887.4992255869594,
"y": 1241.217022398646
},
{
"x": 886.2403469720623,
"y": 1731.443450979552
},
{
"x": 893.0463669502711,
"y": 1741.854521991982
},
{
"x": 912.1052229720045,
"y": 1749.3528358573435
},
{
"x": 895.2349473799088,
"y": 1704.362977043826
},
{
"x": 903.2105090827367,
"y": 1694.8915166646925
},
{
"x": 887.5725349860079,
"y": 1724.7119996376448
},
{
"x": 885.0166869592182,
"y": 1727.574192337558
},
{
"x": 895.2109700324197,
"y": 1717.04524365818
},
{
"x": 879.1567131135857,
"y": 1714.4820080024783
},
{
"x": 893.353115800354,
"y": 1696.1196157158179
},
{
"x": 901.5068505147609,
"y": 1718.3023749604986
},
{
"x": 901.4914502072938,
"y": 1724.4518018568367
},
{
"x": 896.3319955903937,
"y": 1674.6850769470807
},
{
"x": 879.733801633794,
"y": 1636.1101343251485
}
]
}
],
"drilldown": {},
"tooltip": {
"enabled": true,
"useHTML": false,
"format": null,
"headerFormat": "",
"pointFormat": "<span style=\"color:{series.color}\">Single</span>: <b>{point.x:.0f}</b><br><span style=\"color:{series.color}\">Multi</span>: <b>{point.y:.0f}</b>",
"footerFormat": "",
"shared": false,
"outside": false,
"valueDecimals": null,
"split": false
},
"annotations": null
},
"hc_type": "chart",
"id": "332920914292565913001607757491971531634"
}
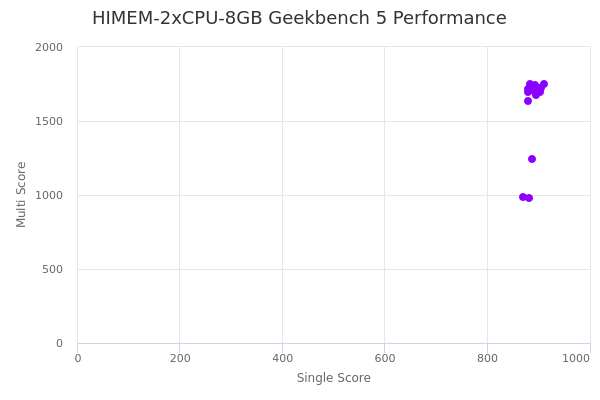
| Single | Multi | |
|---|---|---|
| Max | 912 | 1749 |
| Average | 891 | 1617 |
| Deviation | 10.46 | 236.14 |
| Min | 869 | 977 |
Sign up as Freemium to get more insight.