c4.xlarge.2 by T-Systems Open Telekom Cloud
Geekbench is a cross-platform processor benchmark with a scoring system that determines single-core and multi-core performance using loads simulating real-world scenarios. Geekbench 5 score is calculated with a reference score of 2500 representing the performance of the Intel Core i5-2520M @ 2.50 GHz. The software benchmark is available for Mac OS, Windows, Linux, Android and iOS platforms.
Specifications:
CPU
4
RAM
8.0 GB
{
"configuration": {
"chart": {
"type": "scatter",
"polar": false,
"zoomType": "",
"options3d": {},
"height": null,
"width": null,
"margin": null,
"inverted": false,
"zooming": {}
},
"credits": {
"enabled": false
},
"title": {
"text": ""
},
"colorAxis": null,
"subtitle": {
"text": ""
},
"xAxis": {
"title": {
"text": [
"Single Score"
],
"useHTML": false,
"style": {
"color": "#666666"
}
},
"categories": null,
"lineWidth": 1,
"tickInterval": null,
"tickWidth": 1,
"tickLength": 10,
"tickPixelInterval": 100,
"plotLines": null,
"labels": {
"enabled": true,
"format": null,
"formatter": "",
"style": {
"color": "#666666",
"cursor": "default",
"fontSize": "11px"
},
"useHTML": false,
"step": 0
},
"plotBands": null,
"visible": true,
"floor": null,
"ceiling": null,
"type": "linear",
"min": 0,
"gridLineWidth": 1,
"gridLineColor": "#e6e6e6",
"minorTickInterval": null,
"minorTickWidth": 0,
"minTickInterval": null,
"startOnTick": true,
"endOnTick": true,
"tickmarkPlacement": 100,
"units": 100,
"minRange": 100
},
"yAxis": {
"title": {
"text": [
"Multi Score"
],
"useHTML": false,
"style": {
"color": "#666666"
}
},
"categories": null,
"plotLines": null,
"plotBands": null,
"lineWidth": null,
"tickInterval": null,
"tickLength": 10,
"floor": null,
"ceiling": null,
"gridLineInterpolation": null,
"gridLineWidth": 1,
"gridLineColor": "#e6e6e6",
"min": 0,
"max": null,
"minorTickInterval": null,
"minorTickWidth": 0,
"minTickInterval": null,
"startOnTick": true,
"endOnTick": true,
"minRange": null,
"type": "linear",
"tickmarkPlacement": null,
"labels": {
"enabled": true,
"formatter": null,
"style": {
"color": "#666666",
"cursor": "default",
"fontSize": "11px"
},
"useHTML": false
}
},
"zAxis": {
"title": {
"text": "Multi Score"
}
},
"plotOptions": {
"series": {
"dataLabels": {
"enabled": false,
"format": null,
"distance": 30,
"align": "center",
"inside": null,
"allowOverlap": false,
"style": {
"fontSize": "11px"
}
},
"showInLegend": null,
"turboThreshold": 0,
"stacking": "",
"groupPadding": 0.2,
"centerInCategory": false,
"findNearestPointBy": "x"
}
},
"navigator": {
"enabled": false
},
"scrollbar": {
"enabled": false
},
"rangeSelector": {
"enabled": false,
"inputEnabled": false
},
"legend": {
"enabled": null,
"maxHeight": null,
"align": "center",
"verticalAlign": "bottom",
"layout": "horizontal",
"width": null,
"margin": 12,
"reversed": false
},
"series": [
{
"name": "c4.xlarge.2 by T-Systems Open Telekom Cloud",
"color": "#d1006c",
"data": [
{
"x": 899.5881467059212,
"y": 3466.5205978354443
},
{
"x": 896.0069921483747,
"y": 3463.6862255604274
},
{
"x": 896.8254817471645,
"y": 3471.098647084151
},
{
"x": 889.2164743385033,
"y": 3422.471864276732
},
{
"x": 897.4997288656415,
"y": 3485.3487416832772
},
{
"x": 900.6575730655177,
"y": 3435.0483185027415
},
{
"x": 902.011556796392,
"y": 3503.1272071396925
},
{
"x": 900.7687208045589,
"y": 3472.0359753432385
},
{
"x": 900.0178563311838,
"y": 3484.7018005940618
},
{
"x": 899.9397916941026,
"y": 3406.8478038454855
},
{
"x": 901.5657421564564,
"y": 3481.6995858955884
},
{
"x": 899.9396351965104,
"y": 3450.2707813744923
},
{
"x": 902.065231336574,
"y": 3493.043551405527
},
{
"x": 887.1189668306331,
"y": 3470.067911842556
},
{
"x": 898.9124791395092,
"y": 3490.967776127037
},
{
"x": 899.4163184294279,
"y": 3500.1564827621755
},
{
"x": 903.2954655267555,
"y": 3471.4769300274475
},
{
"x": 900.0240137796693,
"y": 3490.761856032656
},
{
"x": 900.6008342634941,
"y": 3470.1399383488533
},
{
"x": 900.7523593765188,
"y": 3483.4843333262716
}
]
}
],
"drilldown": {},
"tooltip": {
"enabled": true,
"useHTML": false,
"format": null,
"headerFormat": "",
"pointFormat": "<span style=\"color:{series.color}\">Single</span>: <b>{point.x:.0f}</b><br><span style=\"color:{series.color}\">Multi</span>: <b>{point.y:.0f}</b>",
"footerFormat": "",
"shared": false,
"outside": false,
"valueDecimals": null,
"split": false
},
"annotations": null
},
"hc_type": "chart",
"id": "307224089541625337806161103474030195064"
}
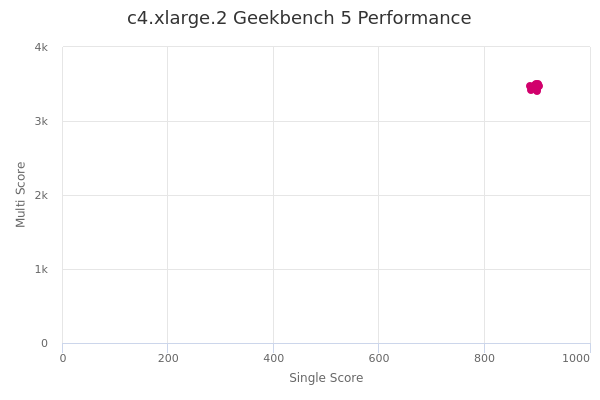
| Single | Multi | |
|---|---|---|
| Max | 903 | 3503 |
| Average | 899 | 3471 |
| Deviation | 3.95 | 24.58 |
| Min | 887 | 3407 |
Sign up as Freemium to get more insight.