c4.large.2 by T-Systems Open Telekom Cloud
Geekbench is a cross-platform processor benchmark with a scoring system that determines single-core and multi-core performance using loads simulating real-world scenarios. Geekbench 5 score is calculated with a reference score of 2500 representing the performance of the Intel Core i5-2520M @ 2.50 GHz. The software benchmark is available for Mac OS, Windows, Linux, Android and iOS platforms.
Specifications:
CPU
2
RAM
4.0 GB
{
"configuration": {
"chart": {
"type": "scatter",
"polar": false,
"zoomType": "",
"options3d": {},
"height": null,
"width": null,
"margin": null,
"inverted": false,
"zooming": {}
},
"credits": {
"enabled": false
},
"title": {
"text": ""
},
"colorAxis": null,
"subtitle": {
"text": ""
},
"xAxis": {
"title": {
"text": [
"Single Score"
],
"useHTML": false,
"style": {
"color": "#666666"
}
},
"categories": null,
"lineWidth": 1,
"tickInterval": null,
"tickWidth": 1,
"tickLength": 10,
"tickPixelInterval": 100,
"plotLines": null,
"labels": {
"enabled": true,
"format": null,
"formatter": "",
"style": {
"color": "#666666",
"cursor": "default",
"fontSize": "11px"
},
"useHTML": false,
"step": 0
},
"plotBands": null,
"visible": true,
"floor": null,
"ceiling": null,
"type": "linear",
"min": 0,
"gridLineWidth": 1,
"gridLineColor": "#e6e6e6",
"minorTickInterval": null,
"minorTickWidth": 0,
"minTickInterval": null,
"startOnTick": true,
"endOnTick": true,
"tickmarkPlacement": 100,
"units": 100,
"minRange": 100
},
"yAxis": {
"title": {
"text": [
"Multi Score"
],
"useHTML": false,
"style": {
"color": "#666666"
}
},
"categories": null,
"plotLines": null,
"plotBands": null,
"lineWidth": null,
"tickInterval": null,
"tickLength": 10,
"floor": null,
"ceiling": null,
"gridLineInterpolation": null,
"gridLineWidth": 1,
"gridLineColor": "#e6e6e6",
"min": 0,
"max": null,
"minorTickInterval": null,
"minorTickWidth": 0,
"minTickInterval": null,
"startOnTick": true,
"endOnTick": true,
"minRange": null,
"type": "linear",
"tickmarkPlacement": null,
"labels": {
"enabled": true,
"formatter": null,
"style": {
"color": "#666666",
"cursor": "default",
"fontSize": "11px"
},
"useHTML": false
}
},
"zAxis": {
"title": {
"text": "Multi Score"
}
},
"plotOptions": {
"series": {
"dataLabels": {
"enabled": false,
"format": null,
"distance": 30,
"align": "center",
"inside": null,
"allowOverlap": false,
"style": {
"fontSize": "11px"
}
},
"showInLegend": null,
"turboThreshold": 0,
"stacking": "",
"groupPadding": 0.2,
"centerInCategory": false,
"findNearestPointBy": "x"
}
},
"navigator": {
"enabled": false
},
"scrollbar": {
"enabled": false
},
"rangeSelector": {
"enabled": false,
"inputEnabled": false
},
"legend": {
"enabled": null,
"maxHeight": null,
"align": "center",
"verticalAlign": "bottom",
"layout": "horizontal",
"width": null,
"margin": 12,
"reversed": false
},
"series": [
{
"name": "c4.large.2 by T-Systems Open Telekom Cloud",
"color": "#d1006c",
"data": [
{
"x": 902.0866425681081,
"y": 1766.944758564896
},
{
"x": 894.9713326140363,
"y": 1752.2132768470578
},
{
"x": 890.8939063445757,
"y": 1744.743924127652
},
{
"x": 889.2372117734897,
"y": 1711.508117601885
},
{
"x": 904.202485932773,
"y": 1776.117169733016
},
{
"x": 898.4146736226328,
"y": 1749.987804215773
},
{
"x": 886.0945506105356,
"y": 1741.017521889521
},
{
"x": 887.5530021301827,
"y": 1750.6977085676442
},
{
"x": 906.207184541116,
"y": 1777.6789202888904
},
{
"x": 895.4956481154655,
"y": 1756.1892676981417
},
{
"x": 887.676154654276,
"y": 1745.2336985782695
},
{
"x": 891.9851555722292,
"y": 1740.229161025105
},
{
"x": 906.0973673347346,
"y": 1771.379270288057
},
{
"x": 887.6389328967805,
"y": 1760.8727061869022
},
{
"x": 893.5412407218106,
"y": 1758.9017808576018
},
{
"x": 891.3384217115583,
"y": 1740.4122746223281
},
{
"x": 891.2243564028258,
"y": 1747.6540022456372
},
{
"x": 892.2384700330404,
"y": 1757.4634272087644
},
{
"x": 895.0030304649297,
"y": 1754.6423145583758
},
{
"x": 884.1935138854535,
"y": 1749.7222076470553
},
{
"x": 884.1317435327264,
"y": 1763.1074355745316
},
{
"x": 891.9817659238647,
"y": 1758.8487222706683
},
{
"x": 895.1661864131229,
"y": 1750.110343676331
},
{
"x": 882.8527773243533,
"y": 1747.7262545055114
},
{
"x": 902.6727713734086,
"y": 1746.986784953185
},
{
"x": 894.6970707400501,
"y": 1758.0192257328986
},
{
"x": 894.0572914063628,
"y": 1724.4875947022224
},
{
"x": 893.5058543865446,
"y": 1750.6181055199859
},
{
"x": 903.7758177726735,
"y": 1773.2889494966776
},
{
"x": 889.9252612275367,
"y": 1752.362380167615
},
{
"x": 897.1949902875623,
"y": 1759.6849344511425
},
{
"x": 887.6773168279983,
"y": 1744.084747600304
},
{
"x": 905.5085892891532,
"y": 1767.4613907899143
},
{
"x": 892.5190390218363,
"y": 1753.9576163054724
},
{
"x": 892.3079878222954,
"y": 1766.6034737332516
},
{
"x": 888.3981188291355,
"y": 1737.4328898698914
},
{
"x": 903.9621041162534,
"y": 1759.0030717148925
},
{
"x": 896.4189231829237,
"y": 1759.32221282896
},
{
"x": 894.0948944174929,
"y": 1737.144409756123
},
{
"x": 890.6860927373399,
"y": 1750.9744873866969
}
]
}
],
"drilldown": {},
"tooltip": {
"enabled": true,
"useHTML": false,
"format": null,
"headerFormat": "",
"pointFormat": "<span style=\"color:{series.color}\">Single</span>: <b>{point.x:.0f}</b><br><span style=\"color:{series.color}\">Multi</span>: <b>{point.y:.0f}</b>",
"footerFormat": "",
"shared": false,
"outside": false,
"valueDecimals": null,
"split": false
},
"annotations": null
},
"hc_type": "chart",
"id": "285478006859735353155271238829315997062"
}
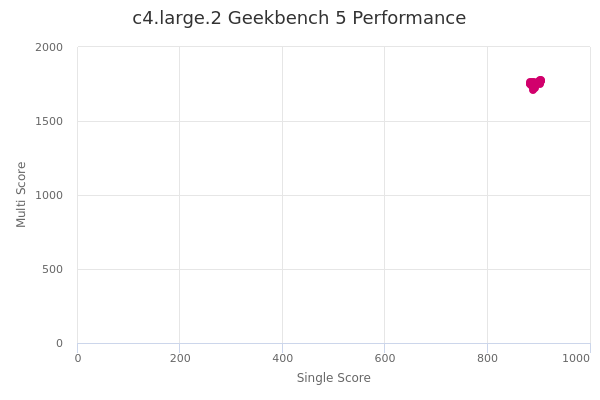
| Single | Multi | |
|---|---|---|
| Max | 906 | 1778 |
| Average | 894 | 1753 |
| Deviation | 6.27 | 12.97 |
| Min | 883 | 1712 |
Sign up as Freemium to get more insight.