c4.2xlarge.2 by T-Systems Open Telekom Cloud
Geekbench is a cross-platform processor benchmark with a scoring system that determines single-core and multi-core performance using loads simulating real-world scenarios. Geekbench 5 score is calculated with a reference score of 2500 representing the performance of the Intel Core i5-2520M @ 2.50 GHz. The software benchmark is available for Mac OS, Windows, Linux, Android and iOS platforms.
Specifications:
CPU
8
RAM
16.0 GB
{
"configuration": {
"chart": {
"type": "scatter",
"polar": false,
"zoomType": "",
"options3d": {},
"height": null,
"width": null,
"margin": null,
"inverted": false,
"zooming": {}
},
"credits": {
"enabled": false
},
"title": {
"text": ""
},
"colorAxis": null,
"subtitle": {
"text": ""
},
"xAxis": {
"title": {
"text": [
"Single Score"
],
"useHTML": false,
"style": {
"color": "#666666"
}
},
"categories": null,
"lineWidth": 1,
"tickInterval": null,
"tickWidth": 1,
"tickLength": 10,
"tickPixelInterval": 100,
"plotLines": null,
"labels": {
"enabled": true,
"format": null,
"formatter": "",
"style": {
"color": "#666666",
"cursor": "default",
"fontSize": "11px"
},
"useHTML": false,
"step": 0
},
"plotBands": null,
"visible": true,
"floor": null,
"ceiling": null,
"type": "linear",
"min": 0,
"gridLineWidth": 1,
"gridLineColor": "#e6e6e6",
"minorTickInterval": null,
"minorTickWidth": 0,
"minTickInterval": null,
"startOnTick": true,
"endOnTick": true,
"tickmarkPlacement": 100,
"units": 100,
"minRange": 100
},
"yAxis": {
"title": {
"text": [
"Multi Score"
],
"useHTML": false,
"style": {
"color": "#666666"
}
},
"categories": null,
"plotLines": null,
"plotBands": null,
"lineWidth": null,
"tickInterval": null,
"tickLength": 10,
"floor": null,
"ceiling": null,
"gridLineInterpolation": null,
"gridLineWidth": 1,
"gridLineColor": "#e6e6e6",
"min": 0,
"max": null,
"minorTickInterval": null,
"minorTickWidth": 0,
"minTickInterval": null,
"startOnTick": true,
"endOnTick": true,
"minRange": null,
"type": "linear",
"tickmarkPlacement": null,
"labels": {
"enabled": true,
"formatter": null,
"style": {
"color": "#666666",
"cursor": "default",
"fontSize": "11px"
},
"useHTML": false
}
},
"zAxis": {
"title": {
"text": "Multi Score"
}
},
"plotOptions": {
"series": {
"dataLabels": {
"enabled": false,
"format": null,
"distance": 30,
"align": "center",
"inside": null,
"allowOverlap": false,
"style": {
"fontSize": "11px"
}
},
"showInLegend": null,
"turboThreshold": 0,
"stacking": "",
"groupPadding": 0.2,
"centerInCategory": false,
"findNearestPointBy": "x"
}
},
"navigator": {
"enabled": false
},
"scrollbar": {
"enabled": false
},
"rangeSelector": {
"enabled": false,
"inputEnabled": false
},
"legend": {
"enabled": null,
"maxHeight": null,
"align": "center",
"verticalAlign": "bottom",
"layout": "horizontal",
"width": null,
"margin": 12,
"reversed": false
},
"series": [
{
"name": "c4.2xlarge.2 by T-Systems Open Telekom Cloud",
"color": "#d1006c",
"data": [
{
"x": 928.321236285047,
"y": 6959.232736474688
},
{
"x": 900.9293535581959,
"y": 6713.7911833902
},
{
"x": 930.191794247906,
"y": 6950.147522695633
},
{
"x": 906.7274046172506,
"y": 6767.996844596697
},
{
"x": 929.8570894766423,
"y": 6936.355372620481
},
{
"x": 898.2135471879908,
"y": 6698.248847713614
},
{
"x": 926.9891594912862,
"y": 6887.638934991874
},
{
"x": 896.2110642863236,
"y": 6763.3011179582545
},
{
"x": 926.8959934756299,
"y": 6954.306637493812
},
{
"x": 907.2511062043118,
"y": 6784.568235012684
},
{
"x": 927.2511415740084,
"y": 6892.511142199177
},
{
"x": 900.1390175098386,
"y": 6778.807609662759
},
{
"x": 929.2719718420509,
"y": 6905.53820339487
},
{
"x": 899.3906134086837,
"y": 6762.547029652353
},
{
"x": 923.4109011281271,
"y": 6887.980145393771
},
{
"x": 911.2331510984734,
"y": 6788.513492060509
},
{
"x": 924.6598539473994,
"y": 6527.46449087555
},
{
"x": 909.3496302782131,
"y": 6724.178543152226
},
{
"x": 888.7840769152726,
"y": 6507.565793880335
},
{
"x": 902.5213576066787,
"y": 6784.718912916471
},
{
"x": 912.3118501063078,
"y": 6832.580992176845
},
{
"x": 908.5418323105653,
"y": 6824.958703961129
},
{
"x": 911.1622373867494,
"y": 6815.507141781134
},
{
"x": 911.3497683014396,
"y": 6806.7310339816795
},
{
"x": 909.6933460638685,
"y": 6791.589239274415
},
{
"x": 910.4340026826837,
"y": 6828.5225026706485
},
{
"x": 916.033579803487,
"y": 6803.558715634157
},
{
"x": 910.4948684373455,
"y": 6813.595946731026
},
{
"x": 911.4245281081035,
"y": 6785.578898812071
},
{
"x": 913.2538556723604,
"y": 6825.835089346354
},
{
"x": 913.8827216464907,
"y": 6812.962559049529
},
{
"x": 909.3094994845346,
"y": 6797.337175740799
},
{
"x": 915.4508684136804,
"y": 6801.188401962368
},
{
"x": 912.0019071697732,
"y": 6804.0163165873155
},
{
"x": 908.1828766791741,
"y": 6814.782355711327
},
{
"x": 911.4426645051951,
"y": 6831.306560956937
},
{
"x": 907.3285243976079,
"y": 6810.082068196642
},
{
"x": 909.9327574949233,
"y": 6830.5522420367415
},
{
"x": 912.7432238043802,
"y": 6807.260233511146
},
{
"x": 908.8300010894106,
"y": 6792.407292778362
}
]
}
],
"drilldown": {},
"tooltip": {
"enabled": true,
"useHTML": false,
"format": null,
"headerFormat": "",
"pointFormat": "<span style=\"color:{series.color}\">Single</span>: <b>{point.x:.0f}</b><br><span style=\"color:{series.color}\">Multi</span>: <b>{point.y:.0f}</b>",
"footerFormat": "",
"shared": false,
"outside": false,
"valueDecimals": null,
"split": false
},
"annotations": null
},
"hc_type": "chart",
"id": "87066532282095682594378712719192356900"
}
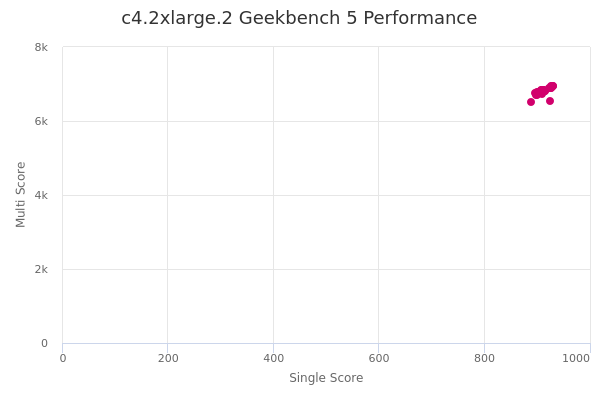
| Single | Multi | |
|---|---|---|
| Max | 930 | 6959 |
| Average | 912 | 6805 |
| Deviation | 9.80 | 89.30 |
| Min | 889 | 6508 |
Sign up as Freemium to get more insight.