c4.3xlarge.4 by T-Systems Open Telekom Cloud
Geekbench is a cross-platform processor benchmark with a scoring system that determines single-core and multi-core performance using loads simulating real-world scenarios. Geekbench 5 score is calculated with a reference score of 2500 representing the performance of the Intel Core i5-2520M @ 2.50 GHz. The software benchmark is available for Mac OS, Windows, Linux, Android and iOS platforms.
Specifications:
CPU
12
RAM
48.0 GB
{
"configuration": {
"chart": {
"type": "scatter",
"polar": false,
"zoomType": "",
"options3d": {},
"height": null,
"width": null,
"margin": null,
"inverted": false,
"zooming": {}
},
"credits": {
"enabled": false
},
"title": {
"text": ""
},
"colorAxis": null,
"subtitle": {
"text": ""
},
"xAxis": {
"title": {
"text": [
"Single Score"
],
"useHTML": false,
"style": {
"color": "#666666"
}
},
"categories": null,
"lineWidth": 1,
"tickInterval": null,
"tickWidth": 1,
"tickLength": 10,
"tickPixelInterval": 100,
"plotLines": null,
"labels": {
"enabled": true,
"format": null,
"formatter": "",
"style": {
"color": "#666666",
"cursor": "default",
"fontSize": "11px"
},
"useHTML": false,
"step": 0
},
"plotBands": null,
"visible": true,
"floor": null,
"ceiling": null,
"type": "linear",
"min": 0,
"gridLineWidth": 1,
"gridLineColor": "#e6e6e6",
"minorTickInterval": null,
"minorTickWidth": 0,
"minTickInterval": null,
"startOnTick": true,
"endOnTick": true,
"tickmarkPlacement": 100,
"units": 100,
"minRange": 100
},
"yAxis": {
"title": {
"text": [
"Multi Score"
],
"useHTML": false,
"style": {
"color": "#666666"
}
},
"categories": null,
"plotLines": null,
"plotBands": null,
"lineWidth": null,
"tickInterval": null,
"tickLength": 10,
"floor": null,
"ceiling": null,
"gridLineInterpolation": null,
"gridLineWidth": 1,
"gridLineColor": "#e6e6e6",
"min": 0,
"max": null,
"minorTickInterval": null,
"minorTickWidth": 0,
"minTickInterval": null,
"startOnTick": true,
"endOnTick": true,
"minRange": null,
"type": "linear",
"tickmarkPlacement": null,
"labels": {
"enabled": true,
"formatter": null,
"style": {
"color": "#666666",
"cursor": "default",
"fontSize": "11px"
},
"useHTML": false
}
},
"zAxis": {
"title": {
"text": "Multi Score"
}
},
"plotOptions": {
"series": {
"dataLabels": {
"enabled": false,
"format": null,
"distance": 30,
"align": "center",
"inside": null,
"allowOverlap": false,
"style": {
"fontSize": "11px"
}
},
"showInLegend": null,
"turboThreshold": 0,
"stacking": "",
"groupPadding": 0.2,
"centerInCategory": false,
"findNearestPointBy": "x"
}
},
"navigator": {
"enabled": false
},
"scrollbar": {
"enabled": false
},
"rangeSelector": {
"enabled": false,
"inputEnabled": false
},
"legend": {
"enabled": null,
"maxHeight": null,
"align": "center",
"verticalAlign": "bottom",
"layout": "horizontal",
"width": null,
"margin": 12,
"reversed": false
},
"series": [
{
"name": "c4.3xlarge.4 by T-Systems Open Telekom Cloud",
"color": "#d1006c",
"data": [
{
"x": 896.9030510204553,
"y": 9845.706244232762
},
{
"x": 870.2636233644605,
"y": 8934.666066490687
},
{
"x": 897.3605690046146,
"y": 9783.357606225047
},
{
"x": 878.4505389397023,
"y": 9021.067052977902
},
{
"x": 897.3365760863202,
"y": 9741.310411764925
},
{
"x": 870.8773086045455,
"y": 8987.867742405451
},
{
"x": 895.6078571561179,
"y": 9730.470950194585
},
{
"x": 853.6688865857054,
"y": 9126.369601801976
},
{
"x": 897.740234180044,
"y": 8211.380771284406
},
{
"x": 881.2509294303788,
"y": 9049.076277426055
},
{
"x": 897.3068984052663,
"y": 6991.034365156509
},
{
"x": 875.0183125919392,
"y": 9094.164234038964
},
{
"x": 877.9066713055976,
"y": 9180.50414082578
},
{
"x": 895.4895878943855,
"y": 6677.257641787351
},
{
"x": 864.630746277328,
"y": 9161.51824498883
},
{
"x": 898.1750385078899,
"y": 8072.901635925635
},
{
"x": 897.1210926392246,
"y": 9811.724579554884
},
{
"x": 868.9987842082211,
"y": 9014.25526257785
},
{
"x": 895.7366743369194,
"y": 8467.614854918267
},
{
"x": 845.0428844671793,
"y": 9168.044205943126
}
]
}
],
"drilldown": {},
"tooltip": {
"enabled": true,
"useHTML": false,
"format": null,
"headerFormat": "",
"pointFormat": "<span style=\"color:{series.color}\">Single</span>: <b>{point.x:.0f}</b><br><span style=\"color:{series.color}\">Multi</span>: <b>{point.y:.0f}</b>",
"footerFormat": "",
"shared": false,
"outside": false,
"valueDecimals": null,
"split": false
},
"annotations": null
},
"hc_type": "chart",
"id": "168667581818750811831775010328378745172"
}
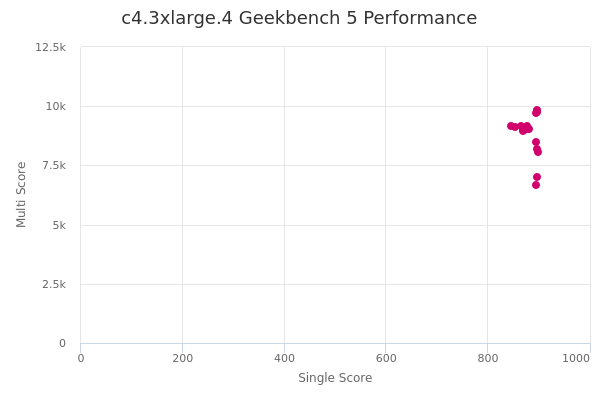
| Single | Multi | |
|---|---|---|
| Max | 898 | 9846 |
| Average | 883 | 8904 |
| Deviation | 16.11 | 842.61 |
| Min | 845 | 6677 |
Sign up as Freemium to get more insight.