GP1-XS by Scaleway
Geekbench is a cross-platform processor benchmark with a scoring system that determines single-core and multi-core performance using loads simulating real-world scenarios. Geekbench 5 score is calculated with a reference score of 2500 representing the performance of the Intel Core i5-2520M @ 2.50 GHz. The software benchmark is available for Mac OS, Windows, Linux, Android and iOS platforms.
Specifications:
CPU
4
RAM
16.0 GB
Net
476 Mbps
{
"configuration": {
"chart": {
"type": "scatter",
"polar": false,
"zoomType": "",
"options3d": {},
"height": null,
"width": null,
"margin": null,
"inverted": false,
"zooming": {}
},
"credits": {
"enabled": false
},
"title": {
"text": ""
},
"colorAxis": null,
"subtitle": {
"text": ""
},
"xAxis": {
"title": {
"text": [
"Single Score"
],
"useHTML": false,
"style": {
"color": "#666666"
}
},
"categories": null,
"lineWidth": 1,
"tickInterval": null,
"tickWidth": 1,
"tickLength": 10,
"tickPixelInterval": 100,
"plotLines": null,
"labels": {
"enabled": true,
"format": null,
"formatter": "",
"style": {
"color": "#666666",
"cursor": "default",
"fontSize": "11px"
},
"useHTML": false,
"step": 0
},
"plotBands": null,
"visible": true,
"floor": null,
"ceiling": null,
"type": "linear",
"min": 0,
"gridLineWidth": 1,
"gridLineColor": "#e6e6e6",
"minorTickInterval": null,
"minorTickWidth": 0,
"minTickInterval": null,
"startOnTick": true,
"endOnTick": true,
"tickmarkPlacement": 100,
"units": 100,
"minRange": 100
},
"yAxis": {
"title": {
"text": [
"Multi Score"
],
"useHTML": false,
"style": {
"color": "#666666"
}
},
"categories": null,
"plotLines": null,
"plotBands": null,
"lineWidth": null,
"tickInterval": null,
"tickLength": 10,
"floor": null,
"ceiling": null,
"gridLineInterpolation": null,
"gridLineWidth": 1,
"gridLineColor": "#e6e6e6",
"min": 0,
"max": null,
"minorTickInterval": null,
"minorTickWidth": 0,
"minTickInterval": null,
"startOnTick": true,
"endOnTick": true,
"minRange": null,
"type": "linear",
"tickmarkPlacement": null,
"labels": {
"enabled": true,
"formatter": null,
"style": {
"color": "#666666",
"cursor": "default",
"fontSize": "11px"
},
"useHTML": false
}
},
"zAxis": {
"title": {
"text": "Multi Score"
}
},
"plotOptions": {
"series": {
"dataLabels": {
"enabled": false,
"format": null,
"distance": 30,
"align": "center",
"inside": null,
"allowOverlap": false,
"style": {
"fontSize": "11px"
}
},
"showInLegend": null,
"turboThreshold": 0,
"stacking": "",
"groupPadding": 0.2,
"centerInCategory": false,
"findNearestPointBy": "x"
}
},
"navigator": {
"enabled": false
},
"scrollbar": {
"enabled": false
},
"rangeSelector": {
"enabled": false,
"inputEnabled": false
},
"legend": {
"enabled": null,
"maxHeight": null,
"align": "center",
"verticalAlign": "bottom",
"layout": "horizontal",
"width": null,
"margin": 12,
"reversed": false
},
"series": [
{
"name": "GP1-XS by Scaleway",
"color": "#510099",
"data": [
{
"x": 804.8636477057153,
"y": 3004.0150697998033
},
{
"x": 729.8678140025111,
"y": 2430.2435038605677
},
{
"x": 797.6162324651248,
"y": 2950.863793766495
},
{
"x": 715.325893320218,
"y": 2413.8144259006303
},
{
"x": 798.8364168536275,
"y": 2988.4752135114545
},
{
"x": 703.5324143950852,
"y": 2422.214115344721
},
{
"x": 800.7650238401772,
"y": 3010.782725211735
},
{
"x": 690.6099143689992,
"y": 2445.0782464273484
},
{
"x": 811.9621706240143,
"y": 3008.2272415548496
},
{
"x": 719.6518704127429,
"y": 2462.968327244062
},
{
"x": 818.4212052519504,
"y": 3001.212763248999
},
{
"x": 724.2309455998377,
"y": 2436.301664587363
},
{
"x": 811.1763313164233,
"y": 2997.1414348609205
},
{
"x": 704.4661994813462,
"y": 2465.4759993206785
},
{
"x": 808.2448578884255,
"y": 2980.8021285196082
},
{
"x": 725.8898651646558,
"y": 2428.768248158994
},
{
"x": 801.767122430975,
"y": 3004.198391853634
},
{
"x": 813.1043734970156,
"y": 2986.468586489626
},
{
"x": 717.0963390466712,
"y": 2491.595433129469
},
{
"x": 712.9805005424289,
"y": 2402.568941730089
}
]
}
],
"drilldown": {},
"tooltip": {
"enabled": true,
"useHTML": false,
"format": null,
"headerFormat": "",
"pointFormat": "<span style=\"color:{series.color}\">Single</span>: <b>{point.x:.0f}</b><br><span style=\"color:{series.color}\">Multi</span>: <b>{point.y:.0f}</b>",
"footerFormat": "",
"shared": false,
"outside": false,
"valueDecimals": null,
"split": false
},
"annotations": null
},
"hc_type": "chart",
"id": "278211217376187830461311522949735701431"
}
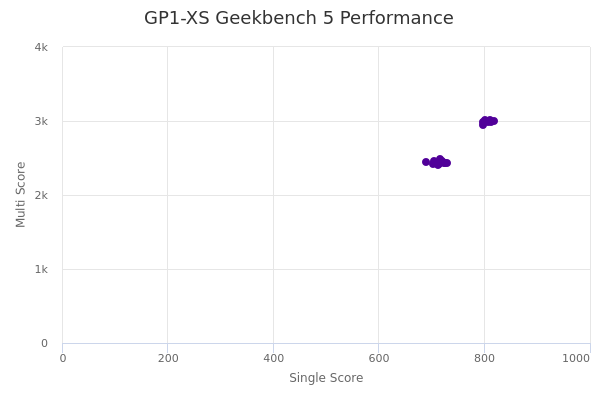
| Single | Multi | |
|---|---|---|
| Max | 818 | 3011 |
| Average | 761 | 2717 |
| Deviation | 47.08 | 277.50 |
| Min | 691 | 2403 |