GP1-L by Scaleway
Geekbench is a cross-platform processor benchmark with a scoring system that determines single-core and multi-core performance using loads simulating real-world scenarios. Geekbench 5 score is calculated with a reference score of 2500 representing the performance of the Intel Core i5-2520M @ 2.50 GHz. The software benchmark is available for Mac OS, Windows, Linux, Android and iOS platforms.
Specifications:
CPU
32
RAM
128.0 GB
Net
4768 Mbps
{
"configuration": {
"chart": {
"type": "scatter",
"polar": false,
"zoomType": "",
"options3d": {},
"height": null,
"width": null,
"margin": null,
"inverted": false,
"zooming": {}
},
"credits": {
"enabled": false
},
"title": {
"text": ""
},
"colorAxis": null,
"subtitle": {
"text": ""
},
"xAxis": {
"title": {
"text": [
"Single Score"
],
"useHTML": false,
"style": {
"color": "#666666"
}
},
"categories": null,
"lineWidth": 1,
"tickInterval": null,
"tickWidth": 1,
"tickLength": 10,
"tickPixelInterval": 100,
"plotLines": null,
"labels": {
"enabled": true,
"format": null,
"formatter": "",
"style": {
"color": "#666666",
"cursor": "default",
"fontSize": "11px"
},
"useHTML": false,
"step": 0
},
"plotBands": null,
"visible": true,
"floor": null,
"ceiling": null,
"type": "linear",
"min": 0,
"gridLineWidth": 1,
"gridLineColor": "#e6e6e6",
"minorTickInterval": null,
"minorTickWidth": 0,
"minTickInterval": null,
"startOnTick": true,
"endOnTick": true,
"tickmarkPlacement": 100,
"units": 100,
"minRange": 100
},
"yAxis": {
"title": {
"text": [
"Multi Score"
],
"useHTML": false,
"style": {
"color": "#666666"
}
},
"categories": null,
"plotLines": null,
"plotBands": null,
"lineWidth": null,
"tickInterval": null,
"tickLength": 10,
"floor": null,
"ceiling": null,
"gridLineInterpolation": null,
"gridLineWidth": 1,
"gridLineColor": "#e6e6e6",
"min": 0,
"max": null,
"minorTickInterval": null,
"minorTickWidth": 0,
"minTickInterval": null,
"startOnTick": true,
"endOnTick": true,
"minRange": null,
"type": "linear",
"tickmarkPlacement": null,
"labels": {
"enabled": true,
"formatter": null,
"style": {
"color": "#666666",
"cursor": "default",
"fontSize": "11px"
},
"useHTML": false
}
},
"zAxis": {
"title": {
"text": "Multi Score"
}
},
"plotOptions": {
"series": {
"dataLabels": {
"enabled": false,
"format": null,
"distance": 30,
"align": "center",
"inside": null,
"allowOverlap": false,
"style": {
"fontSize": "11px"
}
},
"showInLegend": null,
"turboThreshold": 0,
"stacking": "",
"groupPadding": 0.2,
"centerInCategory": false,
"findNearestPointBy": "x"
}
},
"navigator": {
"enabled": false
},
"scrollbar": {
"enabled": false
},
"rangeSelector": {
"enabled": false,
"inputEnabled": false
},
"legend": {
"enabled": null,
"maxHeight": null,
"align": "center",
"verticalAlign": "bottom",
"layout": "horizontal",
"width": null,
"margin": 12,
"reversed": false
},
"series": [
{
"name": "GP1-L by Scaleway",
"color": "#510099",
"data": [
{
"x": 756.0621375976866,
"y": 11110.615325461305
},
{
"x": 711.5223987545849,
"y": 10242.244420252573
},
{
"x": 741.9134778599775,
"y": 11299.714535150446
},
{
"x": 705.2619920507641,
"y": 10598.922732718009
},
{
"x": 734.2206118036902,
"y": 10994.874002732642
},
{
"x": 719.1625582380575,
"y": 10513.316073417554
},
{
"x": 741.1869075281903,
"y": 11232.032140350319
},
{
"x": 699.4471227869782,
"y": 10674.680106834505
},
{
"x": 730.7446304069124,
"y": 11265.713334355463
},
{
"x": 722.5123436578617,
"y": 10820.119103523886
},
{
"x": 749.8692247264555,
"y": 11248.650473202832
},
{
"x": 711.7965621024736,
"y": 10744.355994056648
},
{
"x": 731.20263074576,
"y": 11023.175591595003
},
{
"x": 718.4932513551337,
"y": 10642.221563663163
},
{
"x": 746.2439400110574,
"y": 11123.233078551079
},
{
"x": 728.5160912475949,
"y": 10714.266542515765
},
{
"x": 736.2872635423698,
"y": 11198.522330664426
},
{
"x": 707.9107394031461,
"y": 10883.352156502737
},
{
"x": 749.0911644529873,
"y": 11101.834894673062
},
{
"x": 729.5418084313167,
"y": 10706.562755551606
}
]
}
],
"drilldown": {},
"tooltip": {
"enabled": true,
"useHTML": false,
"format": null,
"headerFormat": "",
"pointFormat": "<span style=\"color:{series.color}\">Single</span>: <b>{point.x:.0f}</b><br><span style=\"color:{series.color}\">Multi</span>: <b>{point.y:.0f}</b>",
"footerFormat": "",
"shared": false,
"outside": false,
"valueDecimals": null,
"split": false
},
"annotations": null
},
"hc_type": "chart",
"id": "227737172464587144926043265230993951086"
}
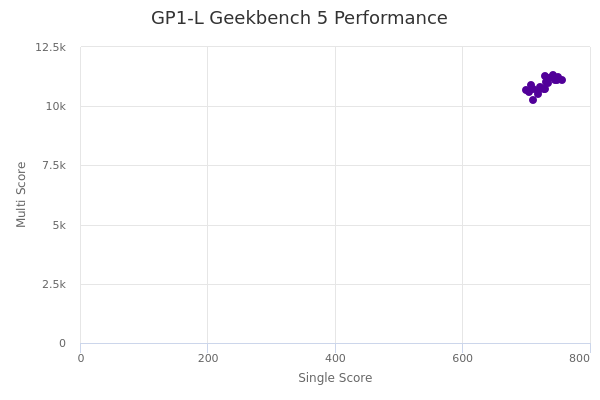
| Single | Multi | |
|---|---|---|
| Max | 756 | 11300 |
| Average | 729 | 10907 |
| Deviation | 15.81 | 288.57 |
| Min | 699 | 10242 |