GP1-M by Scaleway
Geekbench is a cross-platform processor benchmark with a scoring system that determines single-core and multi-core performance using loads simulating real-world scenarios. Geekbench 5 score is calculated with a reference score of 2500 representing the performance of the Intel Core i5-2520M @ 2.50 GHz. The software benchmark is available for Mac OS, Windows, Linux, Android and iOS platforms.
Specifications:
CPU
16
RAM
64.0 GB
Net
1430 Mbps
{
"configuration": {
"chart": {
"type": "scatter",
"polar": false,
"zoomType": "",
"options3d": {},
"height": null,
"width": null,
"margin": null,
"inverted": false,
"zooming": {}
},
"credits": {
"enabled": false
},
"title": {
"text": ""
},
"colorAxis": null,
"subtitle": {
"text": ""
},
"xAxis": {
"title": {
"text": [
"Single Score"
],
"useHTML": false,
"style": {
"color": "#666666"
}
},
"categories": null,
"lineWidth": 1,
"tickInterval": null,
"tickWidth": 1,
"tickLength": 10,
"tickPixelInterval": 100,
"plotLines": null,
"labels": {
"enabled": true,
"format": null,
"formatter": "",
"style": {
"color": "#666666",
"cursor": "default",
"fontSize": "11px"
},
"useHTML": false,
"step": 0
},
"plotBands": null,
"visible": true,
"floor": null,
"ceiling": null,
"type": "linear",
"min": 0,
"gridLineWidth": 1,
"gridLineColor": "#e6e6e6",
"minorTickInterval": null,
"minorTickWidth": 0,
"minTickInterval": null,
"startOnTick": true,
"endOnTick": true,
"tickmarkPlacement": 100,
"units": 100,
"minRange": 100
},
"yAxis": {
"title": {
"text": [
"Multi Score"
],
"useHTML": false,
"style": {
"color": "#666666"
}
},
"categories": null,
"plotLines": null,
"plotBands": null,
"lineWidth": null,
"tickInterval": null,
"tickLength": 10,
"floor": null,
"ceiling": null,
"gridLineInterpolation": null,
"gridLineWidth": 1,
"gridLineColor": "#e6e6e6",
"min": 0,
"max": null,
"minorTickInterval": null,
"minorTickWidth": 0,
"minTickInterval": null,
"startOnTick": true,
"endOnTick": true,
"minRange": null,
"type": "linear",
"tickmarkPlacement": null,
"labels": {
"enabled": true,
"formatter": null,
"style": {
"color": "#666666",
"cursor": "default",
"fontSize": "11px"
},
"useHTML": false
}
},
"zAxis": {
"title": {
"text": "Multi Score"
}
},
"plotOptions": {
"series": {
"dataLabels": {
"enabled": false,
"format": null,
"distance": 30,
"align": "center",
"inside": null,
"allowOverlap": false,
"style": {
"fontSize": "11px"
}
},
"showInLegend": null,
"turboThreshold": 0,
"stacking": "",
"groupPadding": 0.2,
"centerInCategory": false,
"findNearestPointBy": "x"
}
},
"navigator": {
"enabled": false
},
"scrollbar": {
"enabled": false
},
"rangeSelector": {
"enabled": false,
"inputEnabled": false
},
"legend": {
"enabled": null,
"maxHeight": null,
"align": "center",
"verticalAlign": "bottom",
"layout": "horizontal",
"width": null,
"margin": 12,
"reversed": false
},
"series": [
{
"name": "GP1-M by Scaleway",
"color": "#510099",
"data": [
{
"x": 762.5673829705619,
"y": 6132.351415270932
},
{
"x": 733.8338271063303,
"y": 6165.986148618722
},
{
"x": 724.6219944213627,
"y": 6400.863160612169
},
{
"x": 751.6313930359537,
"y": 6078.926419191337
},
{
"x": 761.5335897138748,
"y": 6145.274432048522
},
{
"x": 720.5283082694191,
"y": 6321.132867445971
},
{
"x": 746.1989917800006,
"y": 6102.683226060882
},
{
"x": 720.0165252286449,
"y": 6346.045217145978
},
{
"x": 730.48087853495,
"y": 6345.944939015248
},
{
"x": 768.1197584377721,
"y": 5898.8396427000935
},
{
"x": 751.8408711323351,
"y": 6038.207808215793
},
{
"x": 696.7824196476448,
"y": 6157.629755321063
},
{
"x": 754.6275099125436,
"y": 5668.298663428968
},
{
"x": 710.3099234176746,
"y": 6170.447526425138
},
{
"x": 749.1728003779106,
"y": 6101.8220126128035
},
{
"x": 719.6451088116141,
"y": 6251.79128257515
},
{
"x": 744.9789040121494,
"y": 6089.334598704479
},
{
"x": 703.9734042634182,
"y": 6248.292346508091
},
{
"x": 771.4335435531444,
"y": 6041.112274813654
},
{
"x": 713.0225058780885,
"y": 5986.41491150734
},
{
"x": 973.1978987756587,
"y": 11665.224271129908
},
{
"x": 814.086965746272,
"y": 8435.318567704175
},
{
"x": 974.1927194767371,
"y": 12208.507918173138
},
{
"x": 814.9911022762617,
"y": 8576.311904309283
},
{
"x": 974.3398003920772,
"y": 11976.714375326643
},
{
"x": 805.1927423593561,
"y": 8394.052368666635
},
{
"x": 975.4975463105172,
"y": 11858.778098876566
},
{
"x": 802.7924349671378,
"y": 8251.392692382595
},
{
"x": 971.2196752057203,
"y": 11909.518661217888
},
{
"x": 805.5191915488683,
"y": 8379.661355436734
},
{
"x": 973.5094743168872,
"y": 11857.04969081788
},
{
"x": 967.5682547056366,
"y": 11933.897387262634
},
{
"x": 808.0410445553119,
"y": 8245.639697271406
},
{
"x": 971.2259350476465,
"y": 11955.935991266473
},
{
"x": 806.3422945691378,
"y": 8414.291373350112
},
{
"x": 972.2308435880791,
"y": 11960.021237364937
},
{
"x": 814.609219721634,
"y": 8323.960636128315
},
{
"x": 963.9175054428629,
"y": 11791.406907447403
},
{
"x": 806.403489765421,
"y": 8558.424751401082
},
{
"x": 806.1691565590289,
"y": 8623.076835455204
}
]
}
],
"drilldown": {},
"tooltip": {
"enabled": true,
"useHTML": false,
"format": null,
"headerFormat": "",
"pointFormat": "<span style=\"color:{series.color}\">Single</span>: <b>{point.x:.0f}</b><br><span style=\"color:{series.color}\">Multi</span>: <b>{point.y:.0f}</b>",
"footerFormat": "",
"shared": false,
"outside": false,
"valueDecimals": null,
"split": false
},
"annotations": null
},
"hc_type": "chart",
"id": "278747932722027517272777892016097861066"
}
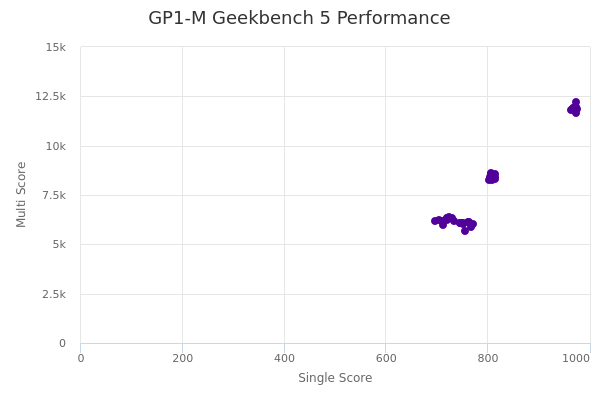
| Single | Multi | |
|---|---|---|
| Max | 975 | 12209 |
| Average | 813 | 8150 |
| Deviation | 97.22 | 2368.29 |
| Min | 697 | 5668 |