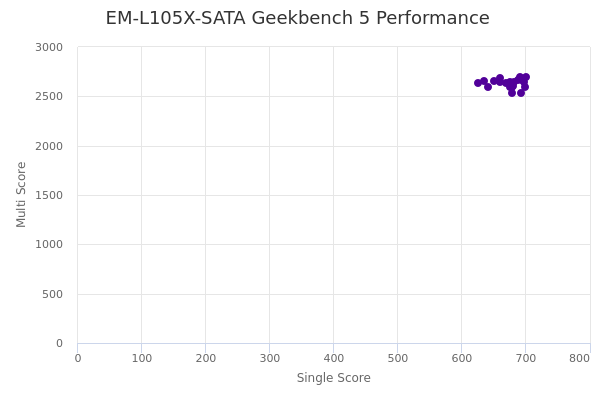
EM-L105X-SATA by Scaleway
Geekbench is a cross-platform processor benchmark with a scoring system that determines single-core and multi-core performance using loads simulating real-world scenarios. Geekbench 5 score is calculated with a reference score of 2500 representing the performance of the Intel Core i5-2520M @ 2.50 GHz. The software benchmark is available for Mac OS, Windows, Linux, Android and iOS platforms.
Specifications:
CPU
8
RAM
89.4 GB
Root
6001 GB
HDD
Extra
3x
6001 GB
N/A
Net
976562 Mbps
{
"configuration": {
"chart": {
"type": "scatter",
"polar": false,
"zoomType": "",
"options3d": {},
"height": null,
"width": null,
"margin": null,
"inverted": false,
"zooming": {}
},
"credits": {
"enabled": false
},
"title": {
"text": ""
},
"colorAxis": null,
"subtitle": {
"text": ""
},
"xAxis": {
"title": {
"text": [
"Single Score"
],
"useHTML": false,
"style": {
"color": "#666666"
}
},
"categories": null,
"lineWidth": 1,
"tickInterval": null,
"tickWidth": 1,
"tickLength": 10,
"tickPixelInterval": 100,
"plotLines": null,
"labels": {
"enabled": true,
"format": null,
"formatter": "",
"style": {
"color": "#666666",
"cursor": "default",
"fontSize": "11px"
},
"useHTML": false,
"step": 0
},
"plotBands": null,
"visible": true,
"floor": null,
"ceiling": null,
"type": "linear",
"min": 0,
"gridLineWidth": 1,
"gridLineColor": "#e6e6e6",
"minorTickInterval": null,
"minorTickWidth": 0,
"minTickInterval": null,
"startOnTick": true,
"endOnTick": true,
"tickmarkPlacement": 100,
"units": 100,
"minRange": 100
},
"yAxis": {
"title": {
"text": [
"Multi Score"
],
"useHTML": false,
"style": {
"color": "#666666"
}
},
"categories": null,
"plotLines": null,
"plotBands": null,
"lineWidth": null,
"tickInterval": null,
"tickLength": 10,
"floor": null,
"ceiling": null,
"gridLineInterpolation": null,
"gridLineWidth": 1,
"gridLineColor": "#e6e6e6",
"min": 0,
"max": null,
"minorTickInterval": null,
"minorTickWidth": 0,
"minTickInterval": null,
"startOnTick": true,
"endOnTick": true,
"minRange": null,
"type": "linear",
"tickmarkPlacement": null,
"labels": {
"enabled": true,
"formatter": null,
"style": {
"color": "#666666",
"cursor": "default",
"fontSize": "11px"
},
"useHTML": false
}
},
"zAxis": {
"title": {
"text": "Multi Score"
}
},
"plotOptions": {
"series": {
"dataLabels": {
"enabled": false,
"format": null,
"distance": 30,
"align": "center",
"inside": null,
"allowOverlap": false,
"style": {
"fontSize": "11px"
}
},
"showInLegend": null,
"turboThreshold": 0,
"stacking": "",
"groupPadding": 0.2,
"centerInCategory": false,
"findNearestPointBy": "x"
}
},
"navigator": {
"enabled": false
},
"scrollbar": {
"enabled": false
},
"rangeSelector": {
"enabled": false,
"inputEnabled": false
},
"legend": {
"enabled": null,
"maxHeight": null,
"align": "center",
"verticalAlign": "bottom",
"layout": "horizontal",
"width": null,
"margin": 12,
"reversed": false
},
"series": [
{
"name": "EM-L105X-SATA by Scaleway",
"color": "#510099",
"data": [
{
"x": 640.775412400204,
"y": 2597.575725233803
},
{
"x": 659.7458476770869,
"y": 2648.057378954335
},
{
"x": 692.7124062615029,
"y": 2537.880684687726
},
{
"x": 635.457829432531,
"y": 2652.6141296717155
},
{
"x": 675.3788014712181,
"y": 2598.698428308731
},
{
"x": 651.1780659484346,
"y": 2652.537761539921
},
{
"x": 698.4166895113735,
"y": 2644.310390025768
},
{
"x": 679.6818516076189,
"y": 2535.399017630273
},
{
"x": 660.8139248498298,
"y": 2684.7321691624547
},
{
"x": 679.0313351505978,
"y": 2591.6776826135956
},
{
"x": 669.7262258063847,
"y": 2639.6827142050406
},
{
"x": 699.3634450026793,
"y": 2594.8402695938057
},
{
"x": 681.0945723751562,
"y": 2604.076712214437
},
{
"x": 688.9583163497582,
"y": 2667.428801836478
},
{
"x": 625.9893355118633,
"y": 2633.914749114883
},
{
"x": 676.4801538754216,
"y": 2649.1972873748587
},
{
"x": 691.0976976446364,
"y": 2698.880847718082
},
{
"x": 695.1057452024859,
"y": 2661.0385185825444
},
{
"x": 700.4859018739613,
"y": 2698.698678565629
},
{
"x": 682.5157077036149,
"y": 2644.8827037090027
}
]
}
],
"drilldown": {},
"tooltip": {
"enabled": true,
"useHTML": false,
"format": null,
"headerFormat": "",
"pointFormat": "<span style=\"color:{series.color}\">Single</span>: <b>{point.x:.0f}</b><br><span style=\"color:{series.color}\">Multi</span>: <b>{point.y:.0f}</b>",
"footerFormat": "",
"shared": false,
"outside": false,
"valueDecimals": null,
"split": false
},
"annotations": null
},
"hc_type": "chart",
"id": "323787667113102128128174896816463912552"
}
| Single | Multi | |
|---|---|---|
| Max | 700 | 2699 |
| Average | 674 | 2632 |
| Deviation | 21.51 | 44.64 |
| Min | 626 | 2535 |
Sign up as Freemium to get more insight.