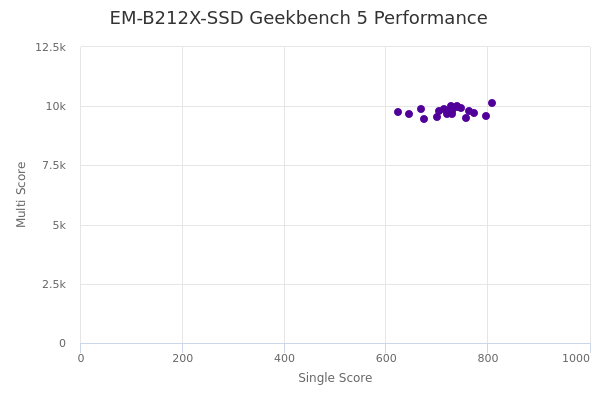
EM-B212X-SSD by Scaleway
Geekbench is a cross-platform processor benchmark with a scoring system that determines single-core and multi-core performance using loads simulating real-world scenarios. Geekbench 5 score is calculated with a reference score of 2500 representing the performance of the Intel Core i5-2520M @ 2.50 GHz. The software benchmark is available for Mac OS, Windows, Linux, Android and iOS platforms.
Specifications:
CPU
32
RAM
238.4 GB
Root
1024 GB
SSD
Extra
1x
1024 GB
N/A
Net
976562 Mbps
{
"configuration": {
"chart": {
"type": "scatter",
"polar": false,
"zoomType": "",
"options3d": {},
"height": null,
"width": null,
"margin": null,
"inverted": false,
"zooming": {}
},
"credits": {
"enabled": false
},
"title": {
"text": ""
},
"colorAxis": null,
"subtitle": {
"text": ""
},
"xAxis": {
"title": {
"text": [
"Single Score"
],
"useHTML": false,
"style": {
"color": "#666666"
}
},
"categories": null,
"lineWidth": 1,
"tickInterval": null,
"tickWidth": 1,
"tickLength": 10,
"tickPixelInterval": 100,
"plotLines": null,
"labels": {
"enabled": true,
"format": null,
"formatter": "",
"style": {
"color": "#666666",
"cursor": "default",
"fontSize": "11px"
},
"useHTML": false,
"step": 0
},
"plotBands": null,
"visible": true,
"floor": null,
"ceiling": null,
"type": "linear",
"min": 0,
"gridLineWidth": 1,
"gridLineColor": "#e6e6e6",
"minorTickInterval": null,
"minorTickWidth": 0,
"minTickInterval": null,
"startOnTick": true,
"endOnTick": true,
"tickmarkPlacement": 100,
"units": 100,
"minRange": 100
},
"yAxis": {
"title": {
"text": [
"Multi Score"
],
"useHTML": false,
"style": {
"color": "#666666"
}
},
"categories": null,
"plotLines": null,
"plotBands": null,
"lineWidth": null,
"tickInterval": null,
"tickLength": 10,
"floor": null,
"ceiling": null,
"gridLineInterpolation": null,
"gridLineWidth": 1,
"gridLineColor": "#e6e6e6",
"min": 0,
"max": null,
"minorTickInterval": null,
"minorTickWidth": 0,
"minTickInterval": null,
"startOnTick": true,
"endOnTick": true,
"minRange": null,
"type": "linear",
"tickmarkPlacement": null,
"labels": {
"enabled": true,
"formatter": null,
"style": {
"color": "#666666",
"cursor": "default",
"fontSize": "11px"
},
"useHTML": false
}
},
"zAxis": {
"title": {
"text": "Multi Score"
}
},
"plotOptions": {
"series": {
"dataLabels": {
"enabled": false,
"format": null,
"distance": 30,
"align": "center",
"inside": null,
"allowOverlap": false,
"style": {
"fontSize": "11px"
}
},
"showInLegend": null,
"turboThreshold": 0,
"stacking": "",
"groupPadding": 0.2,
"centerInCategory": false,
"findNearestPointBy": "x"
}
},
"navigator": {
"enabled": false
},
"scrollbar": {
"enabled": false
},
"rangeSelector": {
"enabled": false,
"inputEnabled": false
},
"legend": {
"enabled": null,
"maxHeight": null,
"align": "center",
"verticalAlign": "bottom",
"layout": "horizontal",
"width": null,
"margin": 12,
"reversed": false
},
"series": [
{
"name": "EM-B212X-SSD by Scaleway",
"color": "#510099",
"data": [
{
"x": 739.7360513876093,
"y": 9945.31416403658
},
{
"x": 740.5250289313723,
"y": 10028.828091061643
},
{
"x": 807.4941195081158,
"y": 10151.82249355357
},
{
"x": 796.2344855149067,
"y": 9576.239120327104
},
{
"x": 773.9027605268595,
"y": 9712.680759061263
},
{
"x": 729.9613778699445,
"y": 9673.059506018315
},
{
"x": 700.4378816742496,
"y": 9537.250211340357
},
{
"x": 623.5173778640869,
"y": 9736.758011459182
},
{
"x": 669.074220288975,
"y": 9868.715478159225
},
{
"x": 645.7578470324312,
"y": 9670.19272352863
},
{
"x": 727.4325254894383,
"y": 9989.346410295917
},
{
"x": 725.9197241978833,
"y": 9831.056981029546
},
{
"x": 748.0153433816267,
"y": 9915.932969624406
},
{
"x": 756.7307868619328,
"y": 9512.083899651443
},
{
"x": 675.7617745634631,
"y": 9441.41602659684
},
{
"x": 762.4395321516199,
"y": 9786.897982957238
},
{
"x": 704.4356618963315,
"y": 9782.098257872822
},
{
"x": 713.2347094411979,
"y": 9880.797272927379
},
{
"x": 729.4044702872826,
"y": 9809.900672091611
},
{
"x": 720.5246718206115,
"y": 9684.387535057691
}
]
}
],
"drilldown": {},
"tooltip": {
"enabled": true,
"useHTML": false,
"format": null,
"headerFormat": "",
"pointFormat": "<span style=\"color:{series.color}\">Single</span>: <b>{point.x:.0f}</b><br><span style=\"color:{series.color}\">Multi</span>: <b>{point.y:.0f}</b>",
"footerFormat": "",
"shared": false,
"outside": false,
"valueDecimals": null,
"split": false
},
"annotations": null
},
"hc_type": "chart",
"id": "134069994132844577718658783254856307444"
}
| Single | Multi | |
|---|---|---|
| Max | 807 | 10152 |
| Average | 725 | 9777 |
| Deviation | 45.29 | 178.48 |
| Min | 624 | 9441 |
Sign up as Freemium to get more insight.