EM-B111X-SATA by Scaleway
Geekbench is a cross-platform processor benchmark with a scoring system that determines single-core and multi-core performance using loads simulating real-world scenarios. Geekbench 5 score is calculated with a reference score of 2500 representing the performance of the Intel Core i5-2520M @ 2.50 GHz. The software benchmark is available for Mac OS, Windows, Linux, Android and iOS platforms.
Specifications:
CPU
24
RAM
178.8 GB
Root
8000 GB
HDD
Extra
1x
8000 GB
N/A
Net
976562 Mbps
{
"configuration": {
"chart": {
"type": "scatter",
"polar": false,
"zoomType": "",
"options3d": {},
"height": null,
"width": null,
"margin": null,
"inverted": false,
"zooming": {}
},
"credits": {
"enabled": false
},
"title": {
"text": ""
},
"colorAxis": null,
"subtitle": {
"text": ""
},
"xAxis": {
"title": {
"text": [
"Single Score"
],
"useHTML": false,
"style": {
"color": "#666666"
}
},
"categories": null,
"lineWidth": 1,
"tickInterval": null,
"tickWidth": 1,
"tickLength": 10,
"tickPixelInterval": 100,
"plotLines": null,
"labels": {
"enabled": true,
"format": null,
"formatter": "",
"style": {
"color": "#666666",
"cursor": "default",
"fontSize": "11px"
},
"useHTML": false,
"step": 0
},
"plotBands": null,
"visible": true,
"floor": null,
"ceiling": null,
"type": "linear",
"min": 0,
"gridLineWidth": 1,
"gridLineColor": "#e6e6e6",
"minorTickInterval": null,
"minorTickWidth": 0,
"minTickInterval": null,
"startOnTick": true,
"endOnTick": true,
"tickmarkPlacement": 100,
"units": 100,
"minRange": 100
},
"yAxis": {
"title": {
"text": [
"Multi Score"
],
"useHTML": false,
"style": {
"color": "#666666"
}
},
"categories": null,
"plotLines": null,
"plotBands": null,
"lineWidth": null,
"tickInterval": null,
"tickLength": 10,
"floor": null,
"ceiling": null,
"gridLineInterpolation": null,
"gridLineWidth": 1,
"gridLineColor": "#e6e6e6",
"min": 0,
"max": null,
"minorTickInterval": null,
"minorTickWidth": 0,
"minTickInterval": null,
"startOnTick": true,
"endOnTick": true,
"minRange": null,
"type": "linear",
"tickmarkPlacement": null,
"labels": {
"enabled": true,
"formatter": null,
"style": {
"color": "#666666",
"cursor": "default",
"fontSize": "11px"
},
"useHTML": false
}
},
"zAxis": {
"title": {
"text": "Multi Score"
}
},
"plotOptions": {
"series": {
"dataLabels": {
"enabled": false,
"format": null,
"distance": 30,
"align": "center",
"inside": null,
"allowOverlap": false,
"style": {
"fontSize": "11px"
}
},
"showInLegend": null,
"turboThreshold": 0,
"stacking": "",
"groupPadding": 0.2,
"centerInCategory": false,
"findNearestPointBy": "x"
}
},
"navigator": {
"enabled": false
},
"scrollbar": {
"enabled": false
},
"rangeSelector": {
"enabled": false,
"inputEnabled": false
},
"legend": {
"enabled": null,
"maxHeight": null,
"align": "center",
"verticalAlign": "bottom",
"layout": "horizontal",
"width": null,
"margin": 12,
"reversed": false
},
"series": [
{
"name": "EM-B111X-SATA by Scaleway",
"color": "#510099",
"data": [
{
"x": 554.1997288930222,
"y": 5922.078007740299
},
{
"x": 552.4769975439236,
"y": 5870.5151567309895
},
{
"x": 558.7285632816497,
"y": 5948.851505011087
},
{
"x": 549.0904928527411,
"y": 5883.747438180175
},
{
"x": 550.9647219098238,
"y": 5934.252067893756
},
{
"x": 573.5405164576,
"y": 5737.6960306588935
},
{
"x": 564.2695004540212,
"y": 5781.239363152936
},
{
"x": 533.9820687131904,
"y": 5779.323138294883
},
{
"x": 536.8378630175059,
"y": 6058.558360891565
},
{
"x": 569.014721869534,
"y": 5759.679952392614
},
{
"x": 535.059680351522,
"y": 6040.72412390522
},
{
"x": 569.3372225249841,
"y": 5971.109554393723
},
{
"x": 538.368706736945,
"y": 5839.651696104475
},
{
"x": 554.8580583988522,
"y": 5801.200278247249
},
{
"x": 542.11435046543,
"y": 5910.038178572172
},
{
"x": 544.2917567641473,
"y": 5808.359595532913
},
{
"x": 573.4444775219135,
"y": 5710.533086663727
},
{
"x": 537.685159002355,
"y": 5864.651140974046
},
{
"x": 548.7249029363236,
"y": 5814.4863437834665
},
{
"x": 556.5160213941731,
"y": 5837.223738164834
}
]
}
],
"drilldown": {},
"tooltip": {
"enabled": true,
"useHTML": false,
"format": null,
"headerFormat": "",
"pointFormat": "<span style=\"color:{series.color}\">Single</span>: <b>{point.x:.0f}</b><br><span style=\"color:{series.color}\">Multi</span>: <b>{point.y:.0f}</b>",
"footerFormat": "",
"shared": false,
"outside": false,
"valueDecimals": null,
"split": false
},
"annotations": null
},
"hc_type": "chart",
"id": "52852643569167157797744974908486415818"
}
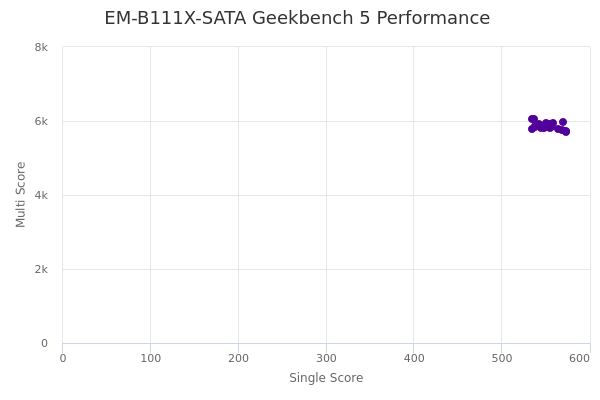
| Single | Multi | |
|---|---|---|
| Max | 574 | 6059 |
| Average | 552 | 5864 |
| Deviation | 12.55 | 93.23 |
| Min | 534 | 5711 |
Sign up as Freemium to get more insight.