s6.xlarge.2 by Orange Business
Geekbench is a cross-platform processor benchmark with a scoring system that determines single-core and multi-core performance using loads simulating real-world scenarios. Geekbench 5 score is calculated with a reference score of 2500 representing the performance of the Intel Core i5-2520M @ 2.50 GHz. The software benchmark is available for Mac OS, Windows, Linux, Android and iOS platforms.
Specifications:
CPU
4
RAM
8.0 GB
{
"configuration": {
"chart": {
"type": "scatter",
"polar": false,
"zoomType": "",
"options3d": {},
"height": null,
"width": null,
"margin": null,
"inverted": false,
"zooming": {}
},
"credits": {
"enabled": false
},
"title": {
"text": ""
},
"colorAxis": null,
"subtitle": {
"text": ""
},
"xAxis": {
"title": {
"text": [
"Single Score"
],
"useHTML": false,
"style": {
"color": "#666666"
}
},
"categories": null,
"lineWidth": 1,
"tickInterval": null,
"tickWidth": 1,
"tickLength": 10,
"tickPixelInterval": 100,
"plotLines": null,
"labels": {
"enabled": true,
"format": null,
"formatter": "",
"style": {
"color": "#666666",
"cursor": "default",
"fontSize": "11px"
},
"useHTML": false,
"step": 0
},
"plotBands": null,
"visible": true,
"floor": null,
"ceiling": null,
"type": "linear",
"min": 0,
"gridLineWidth": 1,
"gridLineColor": "#e6e6e6",
"minorTickInterval": null,
"minorTickWidth": 0,
"minTickInterval": null,
"startOnTick": true,
"endOnTick": true,
"tickmarkPlacement": 100,
"units": 100,
"minRange": 100
},
"yAxis": {
"title": {
"text": [
"Multi Score"
],
"useHTML": false,
"style": {
"color": "#666666"
}
},
"categories": null,
"plotLines": null,
"plotBands": null,
"lineWidth": null,
"tickInterval": null,
"tickLength": 10,
"floor": null,
"ceiling": null,
"gridLineInterpolation": null,
"gridLineWidth": 1,
"gridLineColor": "#e6e6e6",
"min": 0,
"max": null,
"minorTickInterval": null,
"minorTickWidth": 0,
"minTickInterval": null,
"startOnTick": true,
"endOnTick": true,
"minRange": null,
"type": "linear",
"tickmarkPlacement": null,
"labels": {
"enabled": true,
"formatter": null,
"style": {
"color": "#666666",
"cursor": "default",
"fontSize": "11px"
},
"useHTML": false
}
},
"zAxis": {
"title": {
"text": "Multi Score"
}
},
"plotOptions": {
"series": {
"dataLabels": {
"enabled": false,
"format": null,
"distance": 30,
"align": "center",
"inside": null,
"allowOverlap": false,
"style": {
"fontSize": "11px"
}
},
"showInLegend": null,
"turboThreshold": 0,
"stacking": "",
"groupPadding": 0.2,
"centerInCategory": false,
"findNearestPointBy": "x"
}
},
"navigator": {
"enabled": false
},
"scrollbar": {
"enabled": false
},
"rangeSelector": {
"enabled": false,
"inputEnabled": false
},
"legend": {
"enabled": null,
"maxHeight": null,
"align": "center",
"verticalAlign": "bottom",
"layout": "horizontal",
"width": null,
"margin": 12,
"reversed": false
},
"series": [
{
"name": "s6.xlarge.2 by Orange Business",
"color": "#fa6600",
"data": [
{
"x": 929.6833721290228,
"y": 3575.905143644002
},
{
"x": 920.3980427816375,
"y": 3544.8730700328233
},
{
"x": 930.7399594176709,
"y": 3563.004621602462
},
{
"x": 916.5094400403887,
"y": 3529.580981131297
},
{
"x": 927.5677289638236,
"y": 3586.479594398732
},
{
"x": 918.9228300788727,
"y": 3553.282544337657
},
{
"x": 931.8964454281004,
"y": 3566.525916583816
},
{
"x": 915.9580658534323,
"y": 3533.7969739393875
},
{
"x": 931.3092696552453,
"y": 3569.6300203755472
},
{
"x": 910.9154149947055,
"y": 3548.6245815108405
},
{
"x": 930.4357695978092,
"y": 3587.2217167880017
},
{
"x": 904.1208609834327,
"y": 3534.8742145837546
},
{
"x": 927.1634991301892,
"y": 3554.438370858734
},
{
"x": 904.8839215489456,
"y": 3536.5384197161484
},
{
"x": 930.6167108613201,
"y": 3578.239353187183
},
{
"x": 906.907978427658,
"y": 3546.4334050724974
},
{
"x": 933.8928193073313,
"y": 3579.27068927422
},
{
"x": 903.9469852576635,
"y": 3480.3282667017347
},
{
"x": 924.8044082547087,
"y": 3577.087476121571
},
{
"x": 899.5822035125626,
"y": 3494.6897745405704
}
]
}
],
"drilldown": {},
"tooltip": {
"enabled": true,
"useHTML": false,
"format": null,
"headerFormat": "",
"pointFormat": "<span style=\"color:{series.color}\">Single</span>: <b>{point.x:.0f}</b><br><span style=\"color:{series.color}\">Multi</span>: <b>{point.y:.0f}</b>",
"footerFormat": "",
"shared": false,
"outside": false,
"valueDecimals": null,
"split": false
},
"annotations": null
},
"hc_type": "chart",
"id": "268613403277309086281448559994582850073"
}
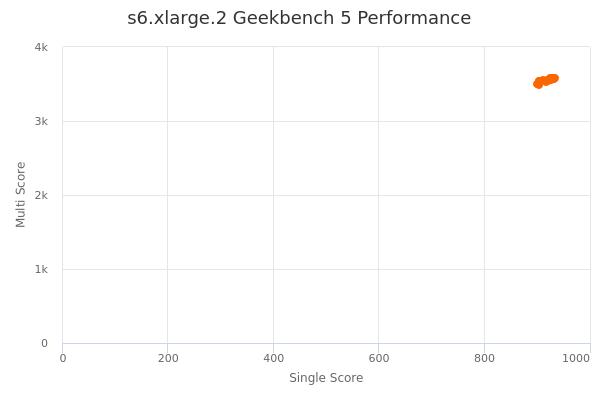
| Single | Multi | |
|---|---|---|
| Max | 934 | 3587 |
| Average | 920 | 3552 |
| Deviation | 11.10 | 27.92 |
| Min | 900 | 3480 |
Sign up as Freemium to get more insight.