s6.large.2 by Orange Business
Geekbench is a cross-platform processor benchmark with a scoring system that determines single-core and multi-core performance using loads simulating real-world scenarios. Geekbench 5 score is calculated with a reference score of 2500 representing the performance of the Intel Core i5-2520M @ 2.50 GHz. The software benchmark is available for Mac OS, Windows, Linux, Android and iOS platforms.
Specifications:
CPU
2
RAM
4.0 GB
{
"configuration": {
"chart": {
"type": "scatter",
"polar": false,
"zoomType": "",
"options3d": {},
"height": null,
"width": null,
"margin": null,
"inverted": false,
"zooming": {}
},
"credits": {
"enabled": false
},
"title": {
"text": ""
},
"colorAxis": null,
"subtitle": {
"text": ""
},
"xAxis": {
"title": {
"text": [
"Single Score"
],
"useHTML": false,
"style": {
"color": "#666666"
}
},
"categories": null,
"lineWidth": 1,
"tickInterval": null,
"tickWidth": 1,
"tickLength": 10,
"tickPixelInterval": 100,
"plotLines": null,
"labels": {
"enabled": true,
"format": null,
"formatter": "",
"style": {
"color": "#666666",
"cursor": "default",
"fontSize": "11px"
},
"useHTML": false,
"step": 0
},
"plotBands": null,
"visible": true,
"floor": null,
"ceiling": null,
"type": "linear",
"min": 0,
"gridLineWidth": 1,
"gridLineColor": "#e6e6e6",
"minorTickInterval": null,
"minorTickWidth": 0,
"minTickInterval": null,
"startOnTick": true,
"endOnTick": true,
"tickmarkPlacement": 100,
"units": 100,
"minRange": 100
},
"yAxis": {
"title": {
"text": [
"Multi Score"
],
"useHTML": false,
"style": {
"color": "#666666"
}
},
"categories": null,
"plotLines": null,
"plotBands": null,
"lineWidth": null,
"tickInterval": null,
"tickLength": 10,
"floor": null,
"ceiling": null,
"gridLineInterpolation": null,
"gridLineWidth": 1,
"gridLineColor": "#e6e6e6",
"min": 0,
"max": null,
"minorTickInterval": null,
"minorTickWidth": 0,
"minTickInterval": null,
"startOnTick": true,
"endOnTick": true,
"minRange": null,
"type": "linear",
"tickmarkPlacement": null,
"labels": {
"enabled": true,
"formatter": null,
"style": {
"color": "#666666",
"cursor": "default",
"fontSize": "11px"
},
"useHTML": false
}
},
"zAxis": {
"title": {
"text": "Multi Score"
}
},
"plotOptions": {
"series": {
"dataLabels": {
"enabled": false,
"format": null,
"distance": 30,
"align": "center",
"inside": null,
"allowOverlap": false,
"style": {
"fontSize": "11px"
}
},
"showInLegend": null,
"turboThreshold": 0,
"stacking": "",
"groupPadding": 0.2,
"centerInCategory": false,
"findNearestPointBy": "x"
}
},
"navigator": {
"enabled": false
},
"scrollbar": {
"enabled": false
},
"rangeSelector": {
"enabled": false,
"inputEnabled": false
},
"legend": {
"enabled": null,
"maxHeight": null,
"align": "center",
"verticalAlign": "bottom",
"layout": "horizontal",
"width": null,
"margin": 12,
"reversed": false
},
"series": [
{
"name": "s6.large.2 by Orange Business",
"color": "#fa6600",
"data": [
{
"x": 931.336873965425,
"y": 1843.2253964439988
},
{
"x": 918.762135950192,
"y": 1795.6117938484
},
{
"x": 932.1179773947547,
"y": 1842.0404040830617
},
{
"x": 914.3024569125391,
"y": 1791.7123124747534
},
{
"x": 930.7667337457137,
"y": 1835.9024530566912
},
{
"x": 915.996626603609,
"y": 1782.5418602086102
},
{
"x": 924.1296237599648,
"y": 1835.0073398727964
},
{
"x": 913.1023669423885,
"y": 1793.0961654121375
},
{
"x": 929.169767233875,
"y": 1834.0500353717998
},
{
"x": 924.3993128346873,
"y": 1807.1490520184193
},
{
"x": 928.7174391985677,
"y": 1828.0497388981482
},
{
"x": 920.4851206292245,
"y": 1817.3692056816399
},
{
"x": 929.1658249265731,
"y": 1829.9537379410501
},
{
"x": 927.2649894358927,
"y": 1819.1261714933785
},
{
"x": 930.1349708735944,
"y": 1831.343801822004
},
{
"x": 923.3658910146853,
"y": 1827.300098834386
},
{
"x": 930.4223775826313,
"y": 1826.9738381672037
},
{
"x": 923.4703529926755,
"y": 1820.370388636456
},
{
"x": 924.5092495115259,
"y": 1828.6120362799156
},
{
"x": 927.4279978700276,
"y": 1819.8594333829606
}
]
}
],
"drilldown": {},
"tooltip": {
"enabled": true,
"useHTML": false,
"format": null,
"headerFormat": "",
"pointFormat": "<span style=\"color:{series.color}\">Single</span>: <b>{point.x:.0f}</b><br><span style=\"color:{series.color}\">Multi</span>: <b>{point.y:.0f}</b>",
"footerFormat": "",
"shared": false,
"outside": false,
"valueDecimals": null,
"split": false
},
"annotations": null
},
"hc_type": "chart",
"id": "68874324665289093619096021190369886272"
}
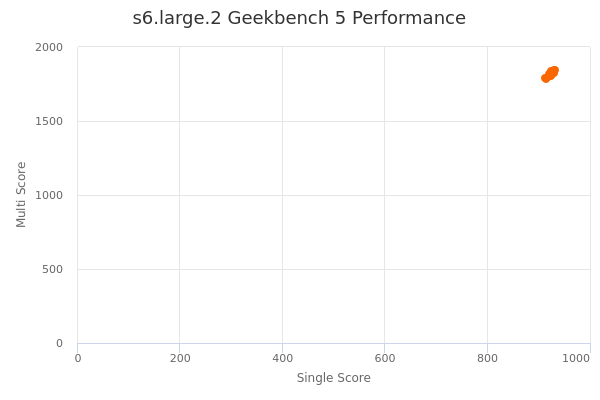
| Single | Multi | |
|---|---|---|
| Max | 932 | 1843 |
| Average | 925 | 1820 |
| Deviation | 5.67 | 17.12 |
| Min | 913 | 1783 |
Sign up as Freemium to get more insight.