s6.large.4 by Orange Business
Geekbench is a cross-platform processor benchmark with a scoring system that determines single-core and multi-core performance using loads simulating real-world scenarios. Geekbench 5 score is calculated with a reference score of 2500 representing the performance of the Intel Core i5-2520M @ 2.50 GHz. The software benchmark is available for Mac OS, Windows, Linux, Android and iOS platforms.
Specifications:
CPU
2
RAM
8.0 GB
{
"configuration": {
"chart": {
"type": "scatter",
"polar": false,
"zoomType": "",
"options3d": {},
"height": null,
"width": null,
"margin": null,
"inverted": false,
"zooming": {}
},
"credits": {
"enabled": false
},
"title": {
"text": ""
},
"colorAxis": null,
"subtitle": {
"text": ""
},
"xAxis": {
"title": {
"text": [
"Single Score"
],
"useHTML": false,
"style": {
"color": "#666666"
}
},
"categories": null,
"lineWidth": 1,
"tickInterval": null,
"tickWidth": 1,
"tickLength": 10,
"tickPixelInterval": 100,
"plotLines": null,
"labels": {
"enabled": true,
"format": null,
"formatter": "",
"style": {
"color": "#666666",
"cursor": "default",
"fontSize": "11px"
},
"useHTML": false,
"step": 0
},
"plotBands": null,
"visible": true,
"floor": null,
"ceiling": null,
"type": "linear",
"min": 0,
"gridLineWidth": 1,
"gridLineColor": "#e6e6e6",
"minorTickInterval": null,
"minorTickWidth": 0,
"minTickInterval": null,
"startOnTick": true,
"endOnTick": true,
"tickmarkPlacement": 100,
"units": 100,
"minRange": 100
},
"yAxis": {
"title": {
"text": [
"Multi Score"
],
"useHTML": false,
"style": {
"color": "#666666"
}
},
"categories": null,
"plotLines": null,
"plotBands": null,
"lineWidth": null,
"tickInterval": null,
"tickLength": 10,
"floor": null,
"ceiling": null,
"gridLineInterpolation": null,
"gridLineWidth": 1,
"gridLineColor": "#e6e6e6",
"min": 0,
"max": null,
"minorTickInterval": null,
"minorTickWidth": 0,
"minTickInterval": null,
"startOnTick": true,
"endOnTick": true,
"minRange": null,
"type": "linear",
"tickmarkPlacement": null,
"labels": {
"enabled": true,
"formatter": null,
"style": {
"color": "#666666",
"cursor": "default",
"fontSize": "11px"
},
"useHTML": false
}
},
"zAxis": {
"title": {
"text": "Multi Score"
}
},
"plotOptions": {
"series": {
"dataLabels": {
"enabled": false,
"format": null,
"distance": 30,
"align": "center",
"inside": null,
"allowOverlap": false,
"style": {
"fontSize": "11px"
}
},
"showInLegend": null,
"turboThreshold": 0,
"stacking": "",
"groupPadding": 0.2,
"centerInCategory": false,
"findNearestPointBy": "x"
}
},
"navigator": {
"enabled": false
},
"scrollbar": {
"enabled": false
},
"rangeSelector": {
"enabled": false,
"inputEnabled": false
},
"legend": {
"enabled": null,
"maxHeight": null,
"align": "center",
"verticalAlign": "bottom",
"layout": "horizontal",
"width": null,
"margin": 12,
"reversed": false
},
"series": [
{
"name": "s6.large.4 by Orange Business",
"color": "#fa6600",
"data": [
{
"x": 929.274862002376,
"y": 1830.21624582353
},
{
"x": 915.9855157266228,
"y": 1806.1542749550924
},
{
"x": 930.0559902505779,
"y": 1829.2155598869695
},
{
"x": 916.486102017449,
"y": 1814.097146275222
},
{
"x": 930.346976144898,
"y": 1836.7121324291138
},
{
"x": 921.5403019905484,
"y": 1825.2390809102774
},
{
"x": 928.4502622240669,
"y": 1831.1307403114872
},
{
"x": 927.9807684189798,
"y": 1831.6259466915076
},
{
"x": 929.9807476611393,
"y": 1834.7667087788554
},
{
"x": 929.1272567601669,
"y": 1819.9767145583628
},
{
"x": 926.2121701219335,
"y": 1813.354639367432
},
{
"x": 922.3064178956906,
"y": 1817.7408610051557
},
{
"x": 912.9619659328573,
"y": 1807.2224373376669
},
{
"x": 928.0751069312237,
"y": 1825.7897254194058
},
{
"x": 921.1488302310768,
"y": 1819.9284199143547
},
{
"x": 928.9065971354389,
"y": 1828.1607860649456
},
{
"x": 926.6369880199013,
"y": 1812.7257176689927
},
{
"x": 922.8505019654706,
"y": 1824.8934494007117
},
{
"x": 924.7758426704768,
"y": 1839.3961042227338
},
{
"x": 931.3128046949785,
"y": 1834.215657473661
}
]
}
],
"drilldown": {},
"tooltip": {
"enabled": true,
"useHTML": false,
"format": null,
"headerFormat": "",
"pointFormat": "<span style=\"color:{series.color}\">Single</span>: <b>{point.x:.0f}</b><br><span style=\"color:{series.color}\">Multi</span>: <b>{point.y:.0f}</b>",
"footerFormat": "",
"shared": false,
"outside": false,
"valueDecimals": null,
"split": false
},
"annotations": null
},
"hc_type": "chart",
"id": "247700230978963237424833317280110320904"
}
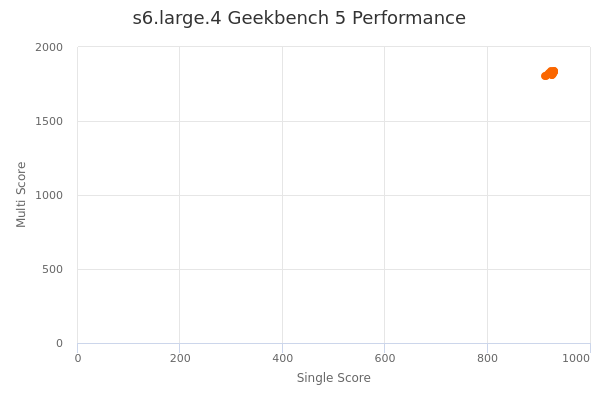
| Single | Multi | |
|---|---|---|
| Max | 931 | 1839 |
| Average | 925 | 1824 |
| Deviation | 5.20 | 9.56 |
| Min | 913 | 1806 |
Sign up as Freemium to get more insight.