s6.medium.2 by Orange Business
Geekbench is a cross-platform processor benchmark with a scoring system that determines single-core and multi-core performance using loads simulating real-world scenarios. Geekbench 5 score is calculated with a reference score of 2500 representing the performance of the Intel Core i5-2520M @ 2.50 GHz. The software benchmark is available for Mac OS, Windows, Linux, Android and iOS platforms.
Specifications:
CPU
1
RAM
2.0 GB
{
"configuration": {
"chart": {
"type": "scatter",
"polar": false,
"zoomType": "",
"options3d": {},
"height": null,
"width": null,
"margin": null,
"inverted": false,
"zooming": {}
},
"credits": {
"enabled": false
},
"title": {
"text": ""
},
"colorAxis": null,
"subtitle": {
"text": ""
},
"xAxis": {
"title": {
"text": [
"Single Score"
],
"useHTML": false,
"style": {
"color": "#666666"
}
},
"categories": null,
"lineWidth": 1,
"tickInterval": null,
"tickWidth": 1,
"tickLength": 10,
"tickPixelInterval": 100,
"plotLines": null,
"labels": {
"enabled": true,
"format": null,
"formatter": "",
"style": {
"color": "#666666",
"cursor": "default",
"fontSize": "11px"
},
"useHTML": false,
"step": 0
},
"plotBands": null,
"visible": true,
"floor": null,
"ceiling": null,
"type": "linear",
"min": 0,
"gridLineWidth": 1,
"gridLineColor": "#e6e6e6",
"minorTickInterval": null,
"minorTickWidth": 0,
"minTickInterval": null,
"startOnTick": true,
"endOnTick": true,
"tickmarkPlacement": 100,
"units": 100,
"minRange": 100
},
"yAxis": {
"title": {
"text": [
"Multi Score"
],
"useHTML": false,
"style": {
"color": "#666666"
}
},
"categories": null,
"plotLines": null,
"plotBands": null,
"lineWidth": null,
"tickInterval": null,
"tickLength": 10,
"floor": null,
"ceiling": null,
"gridLineInterpolation": null,
"gridLineWidth": 1,
"gridLineColor": "#e6e6e6",
"min": 0,
"max": null,
"minorTickInterval": null,
"minorTickWidth": 0,
"minTickInterval": null,
"startOnTick": true,
"endOnTick": true,
"minRange": null,
"type": "linear",
"tickmarkPlacement": null,
"labels": {
"enabled": true,
"formatter": null,
"style": {
"color": "#666666",
"cursor": "default",
"fontSize": "11px"
},
"useHTML": false
}
},
"zAxis": {
"title": {
"text": "Multi Score"
}
},
"plotOptions": {
"series": {
"dataLabels": {
"enabled": false,
"format": null,
"distance": 30,
"align": "center",
"inside": null,
"allowOverlap": false,
"style": {
"fontSize": "11px"
}
},
"showInLegend": null,
"turboThreshold": 0,
"stacking": "",
"groupPadding": 0.2,
"centerInCategory": false,
"findNearestPointBy": "x"
}
},
"navigator": {
"enabled": false
},
"scrollbar": {
"enabled": false
},
"rangeSelector": {
"enabled": false,
"inputEnabled": false
},
"legend": {
"enabled": null,
"maxHeight": null,
"align": "center",
"verticalAlign": "bottom",
"layout": "horizontal",
"width": null,
"margin": 12,
"reversed": false
},
"series": [
{
"name": "s6.medium.2 by Orange Business",
"color": "#fa6600",
"data": [
{
"x": 901.078727534829,
"y": 903.8816554107414
},
{
"x": 892.4046037730669,
"y": 897.0180638734915
},
{
"x": 904.1290274901139,
"y": 904.9052170259611
},
{
"x": 895.226712319001,
"y": 896.4371783062966
},
{
"x": 905.429686728449,
"y": 903.1129436912402
},
{
"x": 897.1947458541216,
"y": 897.9399582398262
},
{
"x": 905.0370043999845,
"y": 899.9004542644614
},
{
"x": 890.6963818867325,
"y": 893.7743364915357
},
{
"x": 903.4973023726141,
"y": 904.3696348079324
},
{
"x": 891.2497916523333,
"y": 892.0507353281787
},
{
"x": 904.0794423028259,
"y": 906.7444000799649
},
{
"x": 892.6447055662634,
"y": 885.3988625530346
},
{
"x": 902.9480867358815,
"y": 905.4688938917561
},
{
"x": 893.9811335620736,
"y": 889.3530453575861
},
{
"x": 892.9266996654753,
"y": 890.6287779807642
},
{
"x": 889.6785246638655,
"y": 882.7738944258392
},
{
"x": 891.6512946810882,
"y": 897.5090292797408
},
{
"x": 885.3886322909894,
"y": 883.6426813571122
},
{
"x": 900.889207135541,
"y": 905.09283878316
},
{
"x": 885.2806469701989,
"y": 887.5288716097842
},
{
"x": 884.786981941985,
"y": 879.8441998890646
},
{
"x": 886.610097697723,
"y": 882.429391946229
},
{
"x": 889.1536441878176,
"y": 888.5995357554086
},
{
"x": 891.7334413908441,
"y": 888.7068316558666
},
{
"x": 890.303903018091,
"y": 886.7634617300729
},
{
"x": 890.4394650869157,
"y": 881.7258428764401
},
{
"x": 884.2644321436318,
"y": 882.8702148793657
},
{
"x": 885.9051533275901,
"y": 884.9590711195065
},
{
"x": 889.3352709287117,
"y": 887.0365765190119
},
{
"x": 890.399159338332,
"y": 886.7056411139241
},
{
"x": 889.4489582314437,
"y": 893.4297692569289
},
{
"x": 883.8833683553303,
"y": 891.3707114567404
},
{
"x": 889.6473381384319,
"y": 893.3360590598479
},
{
"x": 895.7108920648122,
"y": 895.7072060359964
},
{
"x": 890.8539980989773,
"y": 888.4601360492617
},
{
"x": 893.6582439671442,
"y": 886.5092260466045
},
{
"x": 891.6210215811991,
"y": 890.4699492874395
},
{
"x": 895.4546154730077,
"y": 890.1254727359853
},
{
"x": 890.6555730443529,
"y": 887.8683561733169
},
{
"x": 898.8839497774978,
"y": 894.7450473439117
}
]
}
],
"drilldown": {},
"tooltip": {
"enabled": true,
"useHTML": false,
"format": null,
"headerFormat": "",
"pointFormat": "<span style=\"color:{series.color}\">Single</span>: <b>{point.x:.0f}</b><br><span style=\"color:{series.color}\">Multi</span>: <b>{point.y:.0f}</b>",
"footerFormat": "",
"shared": false,
"outside": false,
"valueDecimals": null,
"split": false
},
"annotations": null
},
"hc_type": "chart",
"id": "271641308389078825407284803005208317777"
}
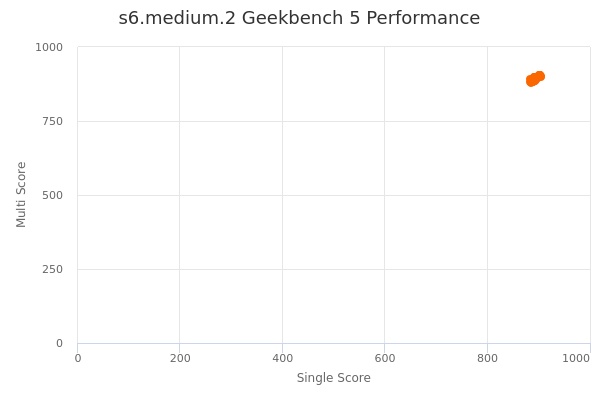
| Single | Multi | |
|---|---|---|
| Max | 905 | 907 |
| Average | 893 | 892 |
| Deviation | 6.12 | 7.46 |
| Min | 884 | 880 |
Sign up as Freemium to get more insight.