1core 8GB 100GB by Nua.ge
Geekbench is a cross-platform processor benchmark with a scoring system that determines single-core and multi-core performance using loads simulating real-world scenarios. Geekbench 5 score is calculated with a reference score of 2500 representing the performance of the Intel Core i5-2520M @ 2.50 GHz. The software benchmark is available for Mac OS, Windows, Linux, Android and iOS platforms.
Specifications:
CPU
1
RAM
8.0 GB
Root
100 GB
Standard root
{
"configuration": {
"chart": {
"type": "scatter",
"polar": false,
"zoomType": "",
"options3d": {},
"height": null,
"width": null,
"margin": null,
"inverted": false,
"zooming": {}
},
"credits": {
"enabled": false
},
"title": {
"text": ""
},
"colorAxis": null,
"subtitle": {
"text": ""
},
"xAxis": {
"title": {
"text": [
"Single Score"
],
"useHTML": false,
"style": {
"color": "#666666"
}
},
"categories": null,
"lineWidth": 1,
"tickInterval": null,
"tickWidth": 1,
"tickLength": 10,
"tickPixelInterval": 100,
"plotLines": null,
"labels": {
"enabled": true,
"format": null,
"formatter": "",
"style": {
"color": "#666666",
"cursor": "default",
"fontSize": "11px"
},
"useHTML": false,
"step": 0
},
"plotBands": null,
"visible": true,
"floor": null,
"ceiling": null,
"type": "linear",
"min": 0,
"gridLineWidth": 1,
"gridLineColor": "#e6e6e6",
"minorTickInterval": null,
"minorTickWidth": 0,
"minTickInterval": null,
"startOnTick": true,
"endOnTick": true,
"tickmarkPlacement": 100,
"units": 100,
"minRange": 100
},
"yAxis": {
"title": {
"text": [
"Multi Score"
],
"useHTML": false,
"style": {
"color": "#666666"
}
},
"categories": null,
"plotLines": null,
"plotBands": null,
"lineWidth": null,
"tickInterval": null,
"tickLength": 10,
"floor": null,
"ceiling": null,
"gridLineInterpolation": null,
"gridLineWidth": 1,
"gridLineColor": "#e6e6e6",
"min": 0,
"max": null,
"minorTickInterval": null,
"minorTickWidth": 0,
"minTickInterval": null,
"startOnTick": true,
"endOnTick": true,
"minRange": null,
"type": "linear",
"tickmarkPlacement": null,
"labels": {
"enabled": true,
"formatter": null,
"style": {
"color": "#666666",
"cursor": "default",
"fontSize": "11px"
},
"useHTML": false
}
},
"zAxis": {
"title": {
"text": "Multi Score"
}
},
"plotOptions": {
"series": {
"dataLabels": {
"enabled": false,
"format": null,
"distance": 30,
"align": "center",
"inside": null,
"allowOverlap": false,
"style": {
"fontSize": "11px"
}
},
"showInLegend": null,
"turboThreshold": 0,
"stacking": "",
"groupPadding": 0.2,
"centerInCategory": false,
"findNearestPointBy": "x"
}
},
"navigator": {
"enabled": false
},
"scrollbar": {
"enabled": false
},
"rangeSelector": {
"enabled": false,
"inputEnabled": false
},
"legend": {
"enabled": null,
"maxHeight": null,
"align": "center",
"verticalAlign": "bottom",
"layout": "horizontal",
"width": null,
"margin": 12,
"reversed": false
},
"series": [
{
"name": "1core 8GB 100GB by Nua.ge",
"color": "#1CC6D9",
"data": [
{
"x": 988.932266958017,
"y": 989.9621778676785
},
{
"x": 862.537538065814,
"y": 861.9925700338218
},
{
"x": 989.1540576774771,
"y": 987.105549079552
},
{
"x": 860.1758057906244,
"y": 860.0176494892045
},
{
"x": 991.1059326114389,
"y": 991.2069247562642
},
{
"x": 863.2097019878433,
"y": 861.7929028497354
},
{
"x": 989.4357500726758,
"y": 988.585962747514
},
{
"x": 862.9697125993448,
"y": 861.2542147124873
},
{
"x": 982.4444216948368,
"y": 965.8141631240956
},
{
"x": 974.3054449066694,
"y": 973.5658022311349
},
{
"x": 968.9190516705544,
"y": 972.47714520711
},
{
"x": 866.4658797384093,
"y": 860.1235942783269
},
{
"x": 972.6963081477493,
"y": 968.8334354897686
},
{
"x": 965.555855049737,
"y": 974.381830374351
},
{
"x": 861.2968015984175,
"y": 861.3924439695934
},
{
"x": 976.7585943894546,
"y": 973.5279382169671
},
{
"x": 863.8955031000664,
"y": 862.9950512410167
},
{
"x": 866.3603578072489,
"y": 861.8998169763984
},
{
"x": 864.9144638280729,
"y": 861.7061518838284
},
{
"x": 863.8677301885509,
"y": 862.8805364320344
}
]
}
],
"drilldown": {},
"tooltip": {
"enabled": true,
"useHTML": false,
"format": null,
"headerFormat": "",
"pointFormat": "<span style=\"color:{series.color}\">Single</span>: <b>{point.x:.0f}</b><br><span style=\"color:{series.color}\">Multi</span>: <b>{point.y:.0f}</b>",
"footerFormat": "",
"shared": false,
"outside": false,
"valueDecimals": null,
"split": false
},
"annotations": null
},
"hc_type": "chart",
"id": "170807115095047257528119855243413989492"
}
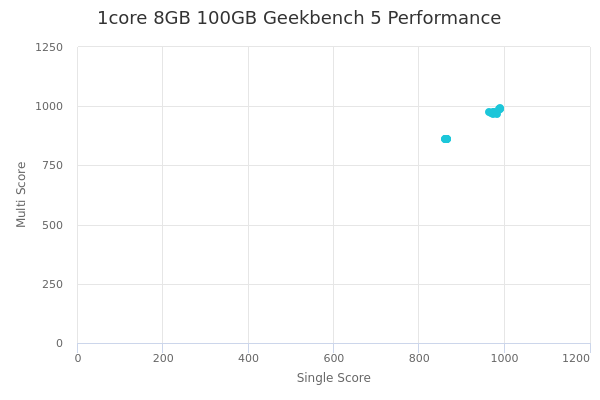
| Single | Multi | |
|---|---|---|
| Max | 991 | 991 |
| Average | 922 | 920 |
| Deviation | 58.54 | 58.83 |
| Min | 860 | 860 |
Sign up as Freemium to get more insight.
- In same series
- 1core 1GB 100GB
- 1core 1GB 500GB
- 1core 2GB 100GB
- 1core 2GB 500GB
- 1core 4GB 100GB
- 1core 4GB 500GB
- 1core 8GB 100GB
- 1core 8GB 500GB
- 2cores 2GB 100GB
- 2cores 2GB 500GB
- 2cores 4GB 100GB
- 2cores 4GB 500GB
- 2cores 8GB 100GB
- 2cores 8GB 500GB
- 2cores 16GB 100GB
- 2cores 16GB 500GB
- 4cores 4GB 100GB
- 4cores 4GB 500GB
- 4cores 8GB 100GB
- 4cores 8GB 500GB
- 4cores 16GB 100GB
- 4cores 16GB 500GB
- 4cores 32GB 100GB
- 4cores 32GB 500GB
- 8cores 8GB 100GB
- 8cores 8GB 500GB
- 8cores 16GB 100GB
- 8cores 16GB 500GB
- 8cores 32GB 100GB
- 8cores 32GB 500GB
- 8cores 64GB 100GB
- 8cores 64GB 500GB
- 8cores 120GB 100GB
- 8cores 120GB 500GB
- 16cores 64GB 100GB
- 16cores 64GB 500GB
- 16cores 120GB 100GB
- 16cores 120GB 500GB
- 16cores 240GB 100GB
- 16cores 240GB 500GB
- 32cores 120GB 100GB
- 32cores 120GB 500GB
- 32cores 240GB 100GB
- 32cores 240GB 500GB