1core 1GB 100GB by Nua.ge
Geekbench is a cross-platform processor benchmark with a scoring system that determines single-core and multi-core performance using loads simulating real-world scenarios. Geekbench 5 score is calculated with a reference score of 2500 representing the performance of the Intel Core i5-2520M @ 2.50 GHz. The software benchmark is available for Mac OS, Windows, Linux, Android and iOS platforms.
Specifications:
CPU
1
RAM
1.0 GB
Root
100 GB
Standard root
{
"configuration": {
"chart": {
"type": "scatter",
"polar": false,
"zoomType": "",
"options3d": {},
"height": null,
"width": null,
"margin": null,
"inverted": false,
"zooming": {}
},
"credits": {
"enabled": false
},
"title": {
"text": ""
},
"colorAxis": null,
"subtitle": {
"text": ""
},
"xAxis": {
"title": {
"text": [
"Single Score"
],
"useHTML": false,
"style": {
"color": "#666666"
}
},
"categories": null,
"lineWidth": 1,
"tickInterval": null,
"tickWidth": 1,
"tickLength": 10,
"tickPixelInterval": 100,
"plotLines": null,
"labels": {
"enabled": true,
"format": null,
"formatter": "",
"style": {
"color": "#666666",
"cursor": "default",
"fontSize": "11px"
},
"useHTML": false,
"step": 0
},
"plotBands": null,
"visible": true,
"floor": null,
"ceiling": null,
"type": "linear",
"min": 0,
"gridLineWidth": 1,
"gridLineColor": "#e6e6e6",
"minorTickInterval": null,
"minorTickWidth": 0,
"minTickInterval": null,
"startOnTick": true,
"endOnTick": true,
"tickmarkPlacement": 100,
"units": 100,
"minRange": 100
},
"yAxis": {
"title": {
"text": [
"Multi Score"
],
"useHTML": false,
"style": {
"color": "#666666"
}
},
"categories": null,
"plotLines": null,
"plotBands": null,
"lineWidth": null,
"tickInterval": null,
"tickLength": 10,
"floor": null,
"ceiling": null,
"gridLineInterpolation": null,
"gridLineWidth": 1,
"gridLineColor": "#e6e6e6",
"min": 0,
"max": null,
"minorTickInterval": null,
"minorTickWidth": 0,
"minTickInterval": null,
"startOnTick": true,
"endOnTick": true,
"minRange": null,
"type": "linear",
"tickmarkPlacement": null,
"labels": {
"enabled": true,
"formatter": null,
"style": {
"color": "#666666",
"cursor": "default",
"fontSize": "11px"
},
"useHTML": false
}
},
"zAxis": {
"title": {
"text": "Multi Score"
}
},
"plotOptions": {
"series": {
"dataLabels": {
"enabled": false,
"format": null,
"distance": 30,
"align": "center",
"inside": null,
"allowOverlap": false,
"style": {
"fontSize": "11px"
}
},
"showInLegend": null,
"turboThreshold": 0,
"stacking": "",
"groupPadding": 0.2,
"centerInCategory": false,
"findNearestPointBy": "x"
}
},
"navigator": {
"enabled": false
},
"scrollbar": {
"enabled": false
},
"rangeSelector": {
"enabled": false,
"inputEnabled": false
},
"legend": {
"enabled": null,
"maxHeight": null,
"align": "center",
"verticalAlign": "bottom",
"layout": "horizontal",
"width": null,
"margin": 12,
"reversed": false
},
"series": [
{
"name": "1core 1GB 100GB by Nua.ge",
"color": "#1CC6D9",
"data": [
{
"x": 969.2132023721277,
"y": 978.7869556683956
},
{
"x": 981.6646541672972,
"y": 977.9266026469311
},
{
"x": 983.7182971339738,
"y": 984.1680506933498
},
{
"x": 956.59678187057,
"y": 923.0595705601696
},
{
"x": 922.9958316471099,
"y": 926.7977755503252
},
{
"x": 918.2587835810778,
"y": 975.5617135511368
},
{
"x": 984.6678058155999,
"y": 979.9513807877729
},
{
"x": 982.558867120564,
"y": 982.60594553184
},
{
"x": 985.1127797605379,
"y": 983.4597257384871
},
{
"x": 986.3303376211832,
"y": 984.2147319502081
},
{
"x": 980.0052548945489,
"y": 979.5073220843988
},
{
"x": 848.5775016726202,
"y": 842.5778227510359
},
{
"x": 985.1793992752957,
"y": 981.9780636113285
},
{
"x": 855.6876217536194,
"y": 852.9744665733956
},
{
"x": 982.7871008594778,
"y": 979.2478570455517
},
{
"x": 854.7587395920677,
"y": 852.6635320927714
},
{
"x": 960.7107146097126,
"y": 940.0168912147301
},
{
"x": 978.8664975999318,
"y": 981.2487940554904
},
{
"x": 977.659573962525,
"y": 975.4020781961015
},
{
"x": 962.9329904735589,
"y": 960.4987214906705
},
{
"x": 958.106657491014,
"y": 961.2832657965964
},
{
"x": 959.9814702507399,
"y": 967.5006173923616
},
{
"x": 854.183823996221,
"y": 851.4732554967037
},
{
"x": 978.4992827675485,
"y": 979.5371194499969
},
{
"x": 850.0565641015369,
"y": 846.861340307901
},
{
"x": 851.0551348956562,
"y": 847.7119188051515
},
{
"x": 851.4431501738318,
"y": 836.9363137089767
}
]
}
],
"drilldown": {},
"tooltip": {
"enabled": true,
"useHTML": false,
"format": null,
"headerFormat": "",
"pointFormat": "<span style=\"color:{series.color}\">Single</span>: <b>{point.x:.0f}</b><br><span style=\"color:{series.color}\">Multi</span>: <b>{point.y:.0f}</b>",
"footerFormat": "",
"shared": false,
"outside": false,
"valueDecimals": null,
"split": false
},
"annotations": null
},
"hc_type": "chart",
"id": "332469851951336611669712504215160940976"
}
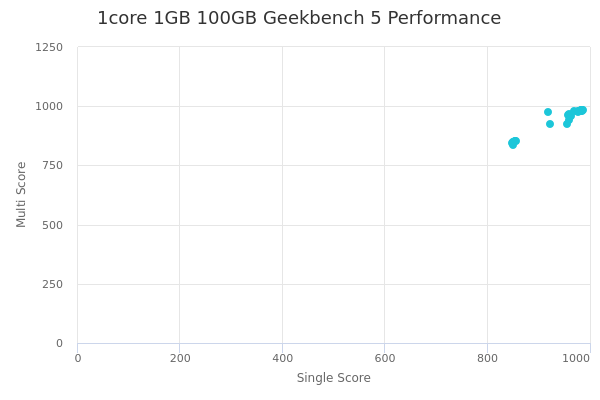
| Single | Multi | |
|---|---|---|
| Max | 986 | 984 |
| Average | 939 | 938 |
| Deviation | 54.10 | 56.16 |
| Min | 849 | 837 |
Sign up as Freemium to get more insight.
- In same series
- 1core 1GB 100GB
- 1core 1GB 500GB
- 1core 2GB 100GB
- 1core 2GB 500GB
- 1core 4GB 100GB
- 1core 4GB 500GB
- 1core 8GB 100GB
- 1core 8GB 500GB
- 2cores 2GB 100GB
- 2cores 2GB 500GB
- 2cores 4GB 100GB
- 2cores 4GB 500GB
- 2cores 8GB 100GB
- 2cores 8GB 500GB
- 2cores 16GB 100GB
- 2cores 16GB 500GB
- 4cores 4GB 100GB
- 4cores 4GB 500GB
- 4cores 8GB 100GB
- 4cores 8GB 500GB
- 4cores 16GB 100GB
- 4cores 16GB 500GB
- 4cores 32GB 100GB
- 4cores 32GB 500GB
- 8cores 8GB 100GB
- 8cores 8GB 500GB
- 8cores 16GB 100GB
- 8cores 16GB 500GB
- 8cores 32GB 100GB
- 8cores 32GB 500GB
- 8cores 64GB 100GB
- 8cores 64GB 500GB
- 8cores 120GB 100GB
- 8cores 120GB 500GB
- 16cores 64GB 100GB
- 16cores 64GB 500GB
- 16cores 120GB 100GB
- 16cores 120GB 500GB
- 16cores 240GB 100GB
- 16cores 240GB 500GB
- 32cores 120GB 100GB
- 32cores 120GB 500GB
- 32cores 240GB 100GB
- 32cores 240GB 500GB