1core 2GB 500GB by Nua.ge
Geekbench is a cross-platform processor benchmark with a scoring system that determines single-core and multi-core performance using loads simulating real-world scenarios. Geekbench 5 score is calculated with a reference score of 2500 representing the performance of the Intel Core i5-2520M @ 2.50 GHz. The software benchmark is available for Mac OS, Windows, Linux, Android and iOS platforms.
Specifications:
CPU
1
RAM
2.0 GB
Root
500 GB
Standard root
{
"configuration": {
"chart": {
"type": "scatter",
"polar": false,
"zoomType": "",
"options3d": {},
"height": null,
"width": null,
"margin": null,
"inverted": false,
"zooming": {}
},
"credits": {
"enabled": false
},
"title": {
"text": ""
},
"colorAxis": null,
"subtitle": {
"text": ""
},
"xAxis": {
"title": {
"text": [
"Single Score"
],
"useHTML": false,
"style": {
"color": "#666666"
}
},
"categories": null,
"lineWidth": 1,
"tickInterval": null,
"tickWidth": 1,
"tickLength": 10,
"tickPixelInterval": 100,
"plotLines": null,
"labels": {
"enabled": true,
"format": null,
"formatter": "",
"style": {
"color": "#666666",
"cursor": "default",
"fontSize": "11px"
},
"useHTML": false,
"step": 0
},
"plotBands": null,
"visible": true,
"floor": null,
"ceiling": null,
"type": "linear",
"min": 0,
"gridLineWidth": 1,
"gridLineColor": "#e6e6e6",
"minorTickInterval": null,
"minorTickWidth": 0,
"minTickInterval": null,
"startOnTick": true,
"endOnTick": true,
"tickmarkPlacement": 100,
"units": 100,
"minRange": 100
},
"yAxis": {
"title": {
"text": [
"Multi Score"
],
"useHTML": false,
"style": {
"color": "#666666"
}
},
"categories": null,
"plotLines": null,
"plotBands": null,
"lineWidth": null,
"tickInterval": null,
"tickLength": 10,
"floor": null,
"ceiling": null,
"gridLineInterpolation": null,
"gridLineWidth": 1,
"gridLineColor": "#e6e6e6",
"min": 0,
"max": null,
"minorTickInterval": null,
"minorTickWidth": 0,
"minTickInterval": null,
"startOnTick": true,
"endOnTick": true,
"minRange": null,
"type": "linear",
"tickmarkPlacement": null,
"labels": {
"enabled": true,
"formatter": null,
"style": {
"color": "#666666",
"cursor": "default",
"fontSize": "11px"
},
"useHTML": false
}
},
"zAxis": {
"title": {
"text": "Multi Score"
}
},
"plotOptions": {
"series": {
"dataLabels": {
"enabled": false,
"format": null,
"distance": 30,
"align": "center",
"inside": null,
"allowOverlap": false,
"style": {
"fontSize": "11px"
}
},
"showInLegend": null,
"turboThreshold": 0,
"stacking": "",
"groupPadding": 0.2,
"centerInCategory": false,
"findNearestPointBy": "x"
}
},
"navigator": {
"enabled": false
},
"scrollbar": {
"enabled": false
},
"rangeSelector": {
"enabled": false,
"inputEnabled": false
},
"legend": {
"enabled": null,
"maxHeight": null,
"align": "center",
"verticalAlign": "bottom",
"layout": "horizontal",
"width": null,
"margin": 12,
"reversed": false
},
"series": [
{
"name": "1core 2GB 500GB by Nua.ge",
"color": "#1CC6D9",
"data": [
{
"x": 968.6037764663977,
"y": 972.511405073102
},
{
"x": 965.0584261174224,
"y": 967.4703070591959
},
{
"x": 976.1396014099935,
"y": 975.8658019949039
},
{
"x": 964.9876486320848,
"y": 957.5731227160314
},
{
"x": 979.2021559416526,
"y": 968.728990766915
},
{
"x": 966.4321798475048,
"y": 961.7814737185333
},
{
"x": 980.0160520102754,
"y": 966.9449027896671
},
{
"x": 972.370314232207,
"y": 954.9492240408608
},
{
"x": 976.9191672687243,
"y": 971.6114000545106
},
{
"x": 964.7086151860044,
"y": 948.9268129246675
},
{
"x": 974.1044198275874,
"y": 975.4449296829155
},
{
"x": 961.7593144399646,
"y": 960.280601998877
},
{
"x": 973.9020924234933,
"y": 964.9214964396745
},
{
"x": 962.5053287046416,
"y": 956.5795609974591
},
{
"x": 979.1024508935791,
"y": 966.8839696908121
},
{
"x": 961.8824892384915,
"y": 962.4662795154084
},
{
"x": 977.8272610027441,
"y": 977.3870200247552
},
{
"x": 941.3624381937652,
"y": 958.3381244741777
},
{
"x": 972.5428898611029,
"y": 978.5785349849755
},
{
"x": 966.3242710349289,
"y": 956.09264085825
}
]
}
],
"drilldown": {},
"tooltip": {
"enabled": true,
"useHTML": false,
"format": null,
"headerFormat": "",
"pointFormat": "<span style=\"color:{series.color}\">Single</span>: <b>{point.x:.0f}</b><br><span style=\"color:{series.color}\">Multi</span>: <b>{point.y:.0f}</b>",
"footerFormat": "",
"shared": false,
"outside": false,
"valueDecimals": null,
"split": false
},
"annotations": null
},
"hc_type": "chart",
"id": "6008163453596474517926644844779525617"
}
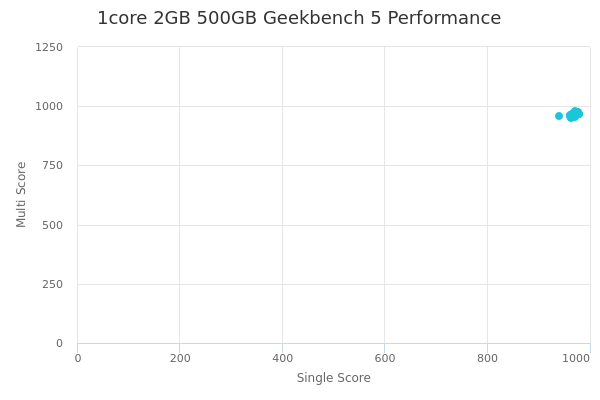
| Single | Multi | |
|---|---|---|
| Max | 980 | 979 |
| Average | 969 | 965 |
| Deviation | 8.84 | 8.19 |
| Min | 941 | 949 |
Sign up as Freemium to get more insight.
- In same series
- 1core 1GB 100GB
- 1core 1GB 500GB
- 1core 2GB 100GB
- 1core 2GB 500GB
- 1core 4GB 100GB
- 1core 4GB 500GB
- 1core 8GB 100GB
- 1core 8GB 500GB
- 2cores 2GB 100GB
- 2cores 2GB 500GB
- 2cores 4GB 100GB
- 2cores 4GB 500GB
- 2cores 8GB 100GB
- 2cores 8GB 500GB
- 2cores 16GB 100GB
- 2cores 16GB 500GB
- 4cores 4GB 100GB
- 4cores 4GB 500GB
- 4cores 8GB 100GB
- 4cores 8GB 500GB
- 4cores 16GB 100GB
- 4cores 16GB 500GB
- 4cores 32GB 100GB
- 4cores 32GB 500GB
- 8cores 8GB 100GB
- 8cores 8GB 500GB
- 8cores 16GB 100GB
- 8cores 16GB 500GB
- 8cores 32GB 100GB
- 8cores 32GB 500GB
- 8cores 64GB 100GB
- 8cores 64GB 500GB
- 8cores 120GB 100GB
- 8cores 120GB 500GB
- 16cores 64GB 100GB
- 16cores 64GB 500GB
- 16cores 120GB 100GB
- 16cores 120GB 500GB
- 16cores 240GB 100GB
- 16cores 240GB 500GB
- 32cores 120GB 100GB
- 32cores 120GB 500GB
- 32cores 240GB 100GB
- 32cores 240GB 500GB