g1-standard-8-16 by G-Core
Geekbench is a cross-platform processor benchmark with a scoring system that determines single-core and multi-core performance using loads simulating real-world scenarios. Geekbench 5 score is calculated with a reference score of 2500 representing the performance of the Intel Core i5-2520M @ 2.50 GHz. The software benchmark is available for Mac OS, Windows, Linux, Android and iOS platforms.
Specifications:
CPU
8
RAM
16.0 GB
{
"configuration": {
"chart": {
"type": "scatter",
"polar": false,
"zoomType": "",
"options3d": {},
"height": null,
"width": null,
"margin": null,
"inverted": false,
"zooming": {}
},
"credits": {
"enabled": false
},
"title": {
"text": ""
},
"colorAxis": null,
"subtitle": {
"text": ""
},
"xAxis": {
"title": {
"text": [
"Single Score"
],
"useHTML": false,
"style": {
"color": "#666666"
}
},
"categories": null,
"lineWidth": 1,
"tickInterval": null,
"tickWidth": 1,
"tickLength": 10,
"tickPixelInterval": 100,
"plotLines": null,
"labels": {
"enabled": true,
"format": null,
"formatter": "",
"style": {
"color": "#666666",
"cursor": "default",
"fontSize": "11px"
},
"useHTML": false,
"step": 0
},
"plotBands": null,
"visible": true,
"floor": null,
"ceiling": null,
"type": "linear",
"min": 0,
"gridLineWidth": 1,
"gridLineColor": "#e6e6e6",
"minorTickInterval": null,
"minorTickWidth": 0,
"minTickInterval": null,
"startOnTick": true,
"endOnTick": true,
"tickmarkPlacement": 100,
"units": 100,
"minRange": 100
},
"yAxis": {
"title": {
"text": [
"Multi Score"
],
"useHTML": false,
"style": {
"color": "#666666"
}
},
"categories": null,
"plotLines": null,
"plotBands": null,
"lineWidth": null,
"tickInterval": null,
"tickLength": 10,
"floor": null,
"ceiling": null,
"gridLineInterpolation": null,
"gridLineWidth": 1,
"gridLineColor": "#e6e6e6",
"min": 0,
"max": null,
"minorTickInterval": null,
"minorTickWidth": 0,
"minTickInterval": null,
"startOnTick": true,
"endOnTick": true,
"minRange": null,
"type": "linear",
"tickmarkPlacement": null,
"labels": {
"enabled": true,
"formatter": null,
"style": {
"color": "#666666",
"cursor": "default",
"fontSize": "11px"
},
"useHTML": false
}
},
"zAxis": {
"title": {
"text": "Multi Score"
}
},
"plotOptions": {
"series": {
"dataLabels": {
"enabled": false,
"format": null,
"distance": 30,
"align": "center",
"inside": null,
"allowOverlap": false,
"style": {
"fontSize": "11px"
}
},
"showInLegend": null,
"turboThreshold": 0,
"stacking": "",
"groupPadding": 0.2,
"centerInCategory": false,
"findNearestPointBy": "x"
}
},
"navigator": {
"enabled": false
},
"scrollbar": {
"enabled": false
},
"rangeSelector": {
"enabled": false,
"inputEnabled": false
},
"legend": {
"enabled": null,
"maxHeight": null,
"align": "center",
"verticalAlign": "bottom",
"layout": "horizontal",
"width": null,
"margin": 12,
"reversed": false
},
"series": [
{
"name": "g1-standard-8-16 by G-Core",
"color": "#F5580F",
"data": [
{
"x": 662.0611801436709,
"y": 4138.306092563482
},
{
"x": 581.4156112640945,
"y": 3572.557354486179
},
{
"x": 672.8965292947809,
"y": 4300.728552923242
},
{
"x": 557.1190384501087,
"y": 3545.4876016013977
},
{
"x": 670.9503903289664,
"y": 4357.300190062229
},
{
"x": 531.3255978677207,
"y": 3501.7711647903398
},
{
"x": 654.7905175220171,
"y": 4262.389424898959
},
{
"x": 592.8653784136233,
"y": 3531.9386230771806
},
{
"x": 666.5340251154404,
"y": 4454.4634917324565
},
{
"x": 609.2683153190952,
"y": 3568.545605059365
},
{
"x": 683.7224966691984,
"y": 4307.806379770704
},
{
"x": 582.05825793642,
"y": 3521.167021932445
},
{
"x": 666.9225926400036,
"y": 4564.947905010256
},
{
"x": 676.7504789997331,
"y": 3947.598424586273
},
{
"x": 587.2515689769177,
"y": 3480.254276711228
},
{
"x": 630.1899041357702,
"y": 4018.9924941891313
},
{
"x": 598.3342910257852,
"y": 3449.9884749460093
},
{
"x": 664.2903860080137,
"y": 3886.8528472334337
},
{
"x": 571.10296120733,
"y": 3200.4432229412714
},
{
"x": 588.8412512408715,
"y": 3585.883571586687
},
{
"x": 954.0144823927903,
"y": 6445.83985744295
},
{
"x": 933.9975360831863,
"y": 6147.844329063428
},
{
"x": 934.6990602629954,
"y": 6471.852803054304
},
{
"x": 951.9124374518376,
"y": 6620.809802467959
},
{
"x": 960.1229260670109,
"y": 6589.138928737118
},
{
"x": 940.2542915580916,
"y": 6423.878299998378
},
{
"x": 942.0946911902353,
"y": 6732.869041346568
},
{
"x": 945.3953595152112,
"y": 6560.080932542543
},
{
"x": 978.527941134395,
"y": 6874.883046307078
},
{
"x": 953.8426712066112,
"y": 6467.775482077484
},
{
"x": 981.3738822729457,
"y": 6791.454424111287
},
{
"x": 956.0353868357399,
"y": 6567.270616647106
},
{
"x": 975.406788752813,
"y": 6910.284686695038
},
{
"x": 930.8681361062618,
"y": 6390.239001679036
},
{
"x": 962.7764357951183,
"y": 6768.301991602319
},
{
"x": 928.5335424531941,
"y": 6409.515915582777
},
{
"x": 966.5173565685423,
"y": 6811.660854443567
},
{
"x": 961.4411498224124,
"y": 6499.724807715267
},
{
"x": 985.3237582036829,
"y": 6808.120762154549
},
{
"x": 960.4113538686033,
"y": 6454.639009516612
}
]
}
],
"drilldown": {},
"tooltip": {
"enabled": true,
"useHTML": false,
"format": null,
"headerFormat": "",
"pointFormat": "<span style=\"color:{series.color}\">Single</span>: <b>{point.x:.0f}</b><br><span style=\"color:{series.color}\">Multi</span>: <b>{point.y:.0f}</b>",
"footerFormat": "",
"shared": false,
"outside": false,
"valueDecimals": null,
"split": false
},
"annotations": null
},
"hc_type": "chart",
"id": "243476443302100874274320718410163599690"
}
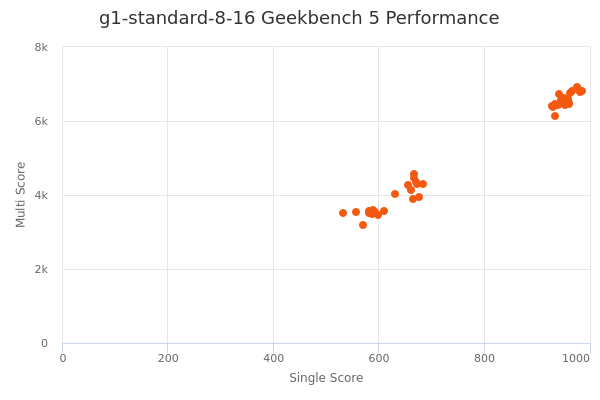
| Single | Multi | |
|---|---|---|
| Max | 985 | 6910 |
| Average | 789 | 5224 |
| Deviation | 169.94 | 1399.48 |
| Min | 531 | 3200 |
Sign up as Freemium to get more insight.