g1-standard-2-4 by G-Core
Geekbench is a cross-platform processor benchmark with a scoring system that determines single-core and multi-core performance using loads simulating real-world scenarios. Geekbench 5 score is calculated with a reference score of 2500 representing the performance of the Intel Core i5-2520M @ 2.50 GHz. The software benchmark is available for Mac OS, Windows, Linux, Android and iOS platforms.
Specifications:
CPU
2
RAM
4.0 GB
{
"configuration": {
"chart": {
"type": "scatter",
"polar": false,
"zoomType": "",
"options3d": {},
"height": null,
"width": null,
"margin": null,
"inverted": false,
"zooming": {}
},
"credits": {
"enabled": false
},
"title": {
"text": ""
},
"colorAxis": null,
"subtitle": {
"text": ""
},
"xAxis": {
"title": {
"text": [
"Single Score"
],
"useHTML": false,
"style": {
"color": "#666666"
}
},
"categories": null,
"lineWidth": 1,
"tickInterval": null,
"tickWidth": 1,
"tickLength": 10,
"tickPixelInterval": 100,
"plotLines": null,
"labels": {
"enabled": true,
"format": null,
"formatter": "",
"style": {
"color": "#666666",
"cursor": "default",
"fontSize": "11px"
},
"useHTML": false,
"step": 0
},
"plotBands": null,
"visible": true,
"floor": null,
"ceiling": null,
"type": "linear",
"min": 0,
"gridLineWidth": 1,
"gridLineColor": "#e6e6e6",
"minorTickInterval": null,
"minorTickWidth": 0,
"minTickInterval": null,
"startOnTick": true,
"endOnTick": true,
"tickmarkPlacement": 100,
"units": 100,
"minRange": 100
},
"yAxis": {
"title": {
"text": [
"Multi Score"
],
"useHTML": false,
"style": {
"color": "#666666"
}
},
"categories": null,
"plotLines": null,
"plotBands": null,
"lineWidth": null,
"tickInterval": null,
"tickLength": 10,
"floor": null,
"ceiling": null,
"gridLineInterpolation": null,
"gridLineWidth": 1,
"gridLineColor": "#e6e6e6",
"min": 0,
"max": null,
"minorTickInterval": null,
"minorTickWidth": 0,
"minTickInterval": null,
"startOnTick": true,
"endOnTick": true,
"minRange": null,
"type": "linear",
"tickmarkPlacement": null,
"labels": {
"enabled": true,
"formatter": null,
"style": {
"color": "#666666",
"cursor": "default",
"fontSize": "11px"
},
"useHTML": false
}
},
"zAxis": {
"title": {
"text": "Multi Score"
}
},
"plotOptions": {
"series": {
"dataLabels": {
"enabled": false,
"format": null,
"distance": 30,
"align": "center",
"inside": null,
"allowOverlap": false,
"style": {
"fontSize": "11px"
}
},
"showInLegend": null,
"turboThreshold": 0,
"stacking": "",
"groupPadding": 0.2,
"centerInCategory": false,
"findNearestPointBy": "x"
}
},
"navigator": {
"enabled": false
},
"scrollbar": {
"enabled": false
},
"rangeSelector": {
"enabled": false,
"inputEnabled": false
},
"legend": {
"enabled": null,
"maxHeight": null,
"align": "center",
"verticalAlign": "bottom",
"layout": "horizontal",
"width": null,
"margin": 12,
"reversed": false
},
"series": [
{
"name": "g1-standard-2-4 by G-Core",
"color": "#F5580F",
"data": [
{
"x": 603.5759051650018,
"y": 1115.4585435278498
},
{
"x": 597.4400523333713,
"y": 1054.7772170817093
},
{
"x": 632.9146800316717,
"y": 1193.7570926616447
},
{
"x": 604.0616477963254,
"y": 1052.5022042334622
},
{
"x": 622.0396927696571,
"y": 1206.337512023584
},
{
"x": 594.5293392566763,
"y": 1102.846731134073
},
{
"x": 618.7128803775154,
"y": 1172.8728949919155
},
{
"x": 586.9907940580883,
"y": 1008.2638661035041
},
{
"x": 632.0836924953136,
"y": 1180.1326803477077
},
{
"x": 619.8323514490733,
"y": 1056.573797601058
},
{
"x": 621.5285908342005,
"y": 1162.8860846721022
},
{
"x": 620.7580490602137,
"y": 1063.9692283049471
},
{
"x": 648.4911196371359,
"y": 1195.0800947034538
},
{
"x": 616.384417392782,
"y": 1113.8364592501603
},
{
"x": 630.6299552398709,
"y": 1218.3417140752229
},
{
"x": 600.1136128557308,
"y": 1099.475819363578
},
{
"x": 637.8827476998596,
"y": 1206.5306138916312
},
{
"x": 607.625833200965,
"y": 1077.2062807169991
},
{
"x": 589.957042057541,
"y": 1124.2151650542064
},
{
"x": 591.143601436095,
"y": 1108.6858767835306
},
{
"x": 958.2725086300809,
"y": 1923.10890832477
},
{
"x": 927.8832810650216,
"y": 1819.5484464378364
},
{
"x": 981.0609812609077,
"y": 1908.5058340118724
},
{
"x": 954.3936296769446,
"y": 1832.241291192886
},
{
"x": 982.5410529873066,
"y": 1937.601592458946
},
{
"x": 943.6125523330837,
"y": 1831.261351447309
},
{
"x": 994.7433860988624,
"y": 1884.1836193027743
},
{
"x": 935.725567831595,
"y": 1815.6185856816728
},
{
"x": 973.138979598108,
"y": 1922.2538368460575
},
{
"x": 934.5619276036626,
"y": 1793.4888200923247
},
{
"x": 987.4635001526797,
"y": 1940.922517399479
},
{
"x": 944.6679847293374,
"y": 1839.274693511802
},
{
"x": 983.878634784335,
"y": 1922.932226824576
},
{
"x": 940.3799180337196,
"y": 1833.7762837780242
},
{
"x": 980.7517610034892,
"y": 1919.9140048637548
},
{
"x": 940.094545471502,
"y": 1848.4043233114144
},
{
"x": 992.5288719014055,
"y": 1895.4612255169927
},
{
"x": 940.0360419919491,
"y": 1825.6956303191764
},
{
"x": 979.816889564195,
"y": 1938.213869456662
},
{
"x": 946.4333455590735,
"y": 1841.1943419506424
}
]
}
],
"drilldown": {},
"tooltip": {
"enabled": true,
"useHTML": false,
"format": null,
"headerFormat": "",
"pointFormat": "<span style=\"color:{series.color}\">Single</span>: <b>{point.x:.0f}</b><br><span style=\"color:{series.color}\">Multi</span>: <b>{point.y:.0f}</b>",
"footerFormat": "",
"shared": false,
"outside": false,
"valueDecimals": null,
"split": false
},
"annotations": null
},
"hc_type": "chart",
"id": "268849876178416047157416798010335578786"
}
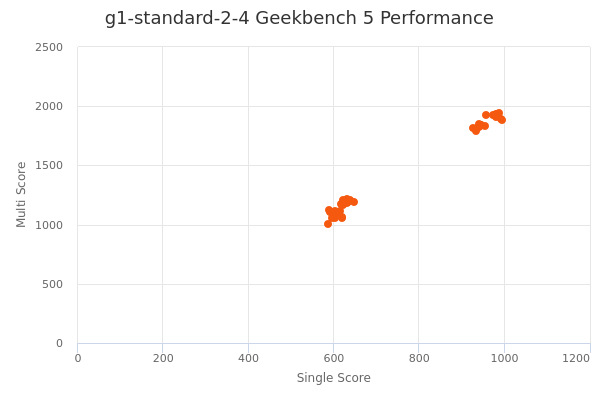
| Single | Multi | |
|---|---|---|
| Max | 995 | 1941 |
| Average | 787 | 1500 |
| Deviation | 174.75 | 378.03 |
| Min | 587 | 1008 |
Sign up as Freemium to get more insight.