g1-standard-4-16 by G-Core
Geekbench is a cross-platform processor benchmark with a scoring system that determines single-core and multi-core performance using loads simulating real-world scenarios. Geekbench 5 score is calculated with a reference score of 2500 representing the performance of the Intel Core i5-2520M @ 2.50 GHz. The software benchmark is available for Mac OS, Windows, Linux, Android and iOS platforms.
Specifications:
CPU
4
RAM
16.0 GB
{
"configuration": {
"chart": {
"type": "scatter",
"polar": false,
"zoomType": "",
"options3d": {},
"height": null,
"width": null,
"margin": null,
"inverted": false,
"zooming": {}
},
"credits": {
"enabled": false
},
"title": {
"text": ""
},
"colorAxis": null,
"subtitle": {
"text": ""
},
"xAxis": {
"title": {
"text": [
"Single Score"
],
"useHTML": false,
"style": {
"color": "#666666"
}
},
"categories": null,
"lineWidth": 1,
"tickInterval": null,
"tickWidth": 1,
"tickLength": 10,
"tickPixelInterval": 100,
"plotLines": null,
"labels": {
"enabled": true,
"format": null,
"formatter": "",
"style": {
"color": "#666666",
"cursor": "default",
"fontSize": "11px"
},
"useHTML": false,
"step": 0
},
"plotBands": null,
"visible": true,
"floor": null,
"ceiling": null,
"type": "linear",
"min": 0,
"gridLineWidth": 1,
"gridLineColor": "#e6e6e6",
"minorTickInterval": null,
"minorTickWidth": 0,
"minTickInterval": null,
"startOnTick": true,
"endOnTick": true,
"tickmarkPlacement": 100,
"units": 100,
"minRange": 100
},
"yAxis": {
"title": {
"text": [
"Multi Score"
],
"useHTML": false,
"style": {
"color": "#666666"
}
},
"categories": null,
"plotLines": null,
"plotBands": null,
"lineWidth": null,
"tickInterval": null,
"tickLength": 10,
"floor": null,
"ceiling": null,
"gridLineInterpolation": null,
"gridLineWidth": 1,
"gridLineColor": "#e6e6e6",
"min": 0,
"max": null,
"minorTickInterval": null,
"minorTickWidth": 0,
"minTickInterval": null,
"startOnTick": true,
"endOnTick": true,
"minRange": null,
"type": "linear",
"tickmarkPlacement": null,
"labels": {
"enabled": true,
"formatter": null,
"style": {
"color": "#666666",
"cursor": "default",
"fontSize": "11px"
},
"useHTML": false
}
},
"zAxis": {
"title": {
"text": "Multi Score"
}
},
"plotOptions": {
"series": {
"dataLabels": {
"enabled": false,
"format": null,
"distance": 30,
"align": "center",
"inside": null,
"allowOverlap": false,
"style": {
"fontSize": "11px"
}
},
"showInLegend": null,
"turboThreshold": 0,
"stacking": "",
"groupPadding": 0.2,
"centerInCategory": false,
"findNearestPointBy": "x"
}
},
"navigator": {
"enabled": false
},
"scrollbar": {
"enabled": false
},
"rangeSelector": {
"enabled": false,
"inputEnabled": false
},
"legend": {
"enabled": null,
"maxHeight": null,
"align": "center",
"verticalAlign": "bottom",
"layout": "horizontal",
"width": null,
"margin": 12,
"reversed": false
},
"series": [
{
"name": "g1-standard-4-16 by G-Core",
"color": "#F5580F",
"data": [
{
"x": 651.2193345276828,
"y": 2532.4902278484274
},
{
"x": 621.9188941635387,
"y": 2234.0155595543483
},
{
"x": 640.7469298221619,
"y": 2246.7518085895144
},
{
"x": 643.6225958380883,
"y": 2281.261716841562
},
{
"x": 624.7573458108491,
"y": 2398.942551443947
},
{
"x": 629.7917166524526,
"y": 2207.531875740088
},
{
"x": 652.7909278024779,
"y": 2301.258732682409
},
{
"x": 624.0128013948853,
"y": 2129.2023168647634
},
{
"x": 643.5993009825734,
"y": 2324.1594562941928
},
{
"x": 632.4153434388378,
"y": 2270.6200738516395
},
{
"x": 653.2437314404394,
"y": 2271.7808792233
},
{
"x": 630.2049157341505,
"y": 2211.270536181986
},
{
"x": 663.0864099550153,
"y": 2216.569478255715
},
{
"x": 647.3326254164705,
"y": 2213.545530390669
},
{
"x": 641.7676699928955,
"y": 2204.6705574177286
},
{
"x": 632.5252023866385,
"y": 2148.813925332433
},
{
"x": 640.8042168160773,
"y": 2181.1072938787634
},
{
"x": 649.9057848429975,
"y": 2179.848265942485
},
{
"x": 610.3413190651097,
"y": 2277.6999163937403
},
{
"x": 619.3409773012925,
"y": 2132.6080396964617
},
{
"x": 998.4560742451656,
"y": 3747.972212071927
},
{
"x": 970.158640021234,
"y": 3566.34728451053
},
{
"x": 987.9440910167801,
"y": 3755.498566902961
},
{
"x": 967.3704326532406,
"y": 3680.6381925994647
},
{
"x": 1001.2481160075686,
"y": 3754.1451182226047
},
{
"x": 969.8333452980701,
"y": 3635.075464778085
},
{
"x": 1006.8352549381987,
"y": 3770.6521985364825
},
{
"x": 968.3035650157162,
"y": 3652.197440206509
},
{
"x": 992.0409987181231,
"y": 3746.7710108090787
},
{
"x": 967.2330834339841,
"y": 3659.3925015808354
},
{
"x": 1005.0765975333189,
"y": 3708.030292729468
},
{
"x": 969.8731499645313,
"y": 3675.734721460628
},
{
"x": 1003.1087874116425,
"y": 3726.858657992984
},
{
"x": 969.6786332971756,
"y": 3662.8197421383747
},
{
"x": 998.5791042184082,
"y": 3777.863981961359
},
{
"x": 960.9226987459458,
"y": 3679.364020557588
},
{
"x": 990.0083605387954,
"y": 3740.991577678499
},
{
"x": 970.1785019376196,
"y": 3622.699824285167
},
{
"x": 990.2649295176438,
"y": 3751.9699958041792
},
{
"x": 972.8522154430902,
"y": 3662.722326435749
}
]
}
],
"drilldown": {},
"tooltip": {
"enabled": true,
"useHTML": false,
"format": null,
"headerFormat": "",
"pointFormat": "<span style=\"color:{series.color}\">Single</span>: <b>{point.x:.0f}</b><br><span style=\"color:{series.color}\">Multi</span>: <b>{point.y:.0f}</b>",
"footerFormat": "",
"shared": false,
"outside": false,
"valueDecimals": null,
"split": false
},
"annotations": null
},
"hc_type": "chart",
"id": "117276503242071324496298792529171879425"
}
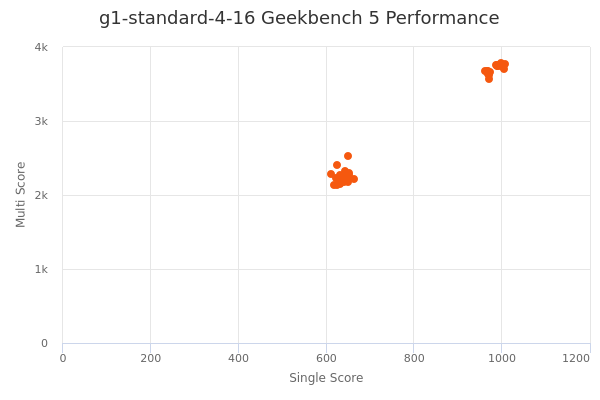
| Single | Multi | |
|---|---|---|
| Max | 1007 | 3778 |
| Average | 810 | 2974 |
| Deviation | 173.25 | 729.33 |
| Min | 610 | 2129 |
Sign up as Freemium to get more insight.