g1-standard-4-8 by G-Core
Geekbench is a cross-platform processor benchmark with a scoring system that determines single-core and multi-core performance using loads simulating real-world scenarios. Geekbench 5 score is calculated with a reference score of 2500 representing the performance of the Intel Core i5-2520M @ 2.50 GHz. The software benchmark is available for Mac OS, Windows, Linux, Android and iOS platforms.
Specifications:
CPU
4
RAM
8.0 GB
{
"configuration": {
"chart": {
"type": "scatter",
"polar": false,
"zoomType": "",
"options3d": {},
"height": null,
"width": null,
"margin": null,
"inverted": false,
"zooming": {}
},
"credits": {
"enabled": false
},
"title": {
"text": ""
},
"colorAxis": null,
"subtitle": {
"text": ""
},
"xAxis": {
"title": {
"text": [
"Single Score"
],
"useHTML": false,
"style": {
"color": "#666666"
}
},
"categories": null,
"lineWidth": 1,
"tickInterval": null,
"tickWidth": 1,
"tickLength": 10,
"tickPixelInterval": 100,
"plotLines": null,
"labels": {
"enabled": true,
"format": null,
"formatter": "",
"style": {
"color": "#666666",
"cursor": "default",
"fontSize": "11px"
},
"useHTML": false,
"step": 0
},
"plotBands": null,
"visible": true,
"floor": null,
"ceiling": null,
"type": "linear",
"min": 0,
"gridLineWidth": 1,
"gridLineColor": "#e6e6e6",
"minorTickInterval": null,
"minorTickWidth": 0,
"minTickInterval": null,
"startOnTick": true,
"endOnTick": true,
"tickmarkPlacement": 100,
"units": 100,
"minRange": 100
},
"yAxis": {
"title": {
"text": [
"Multi Score"
],
"useHTML": false,
"style": {
"color": "#666666"
}
},
"categories": null,
"plotLines": null,
"plotBands": null,
"lineWidth": null,
"tickInterval": null,
"tickLength": 10,
"floor": null,
"ceiling": null,
"gridLineInterpolation": null,
"gridLineWidth": 1,
"gridLineColor": "#e6e6e6",
"min": 0,
"max": null,
"minorTickInterval": null,
"minorTickWidth": 0,
"minTickInterval": null,
"startOnTick": true,
"endOnTick": true,
"minRange": null,
"type": "linear",
"tickmarkPlacement": null,
"labels": {
"enabled": true,
"formatter": null,
"style": {
"color": "#666666",
"cursor": "default",
"fontSize": "11px"
},
"useHTML": false
}
},
"zAxis": {
"title": {
"text": "Multi Score"
}
},
"plotOptions": {
"series": {
"dataLabels": {
"enabled": false,
"format": null,
"distance": 30,
"align": "center",
"inside": null,
"allowOverlap": false,
"style": {
"fontSize": "11px"
}
},
"showInLegend": null,
"turboThreshold": 0,
"stacking": "",
"groupPadding": 0.2,
"centerInCategory": false,
"findNearestPointBy": "x"
}
},
"navigator": {
"enabled": false
},
"scrollbar": {
"enabled": false
},
"rangeSelector": {
"enabled": false,
"inputEnabled": false
},
"legend": {
"enabled": null,
"maxHeight": null,
"align": "center",
"verticalAlign": "bottom",
"layout": "horizontal",
"width": null,
"margin": 12,
"reversed": false
},
"series": [
{
"name": "g1-standard-4-8 by G-Core",
"color": "#F5580F",
"data": [
{
"x": 686.3786888143602,
"y": 2492.038249269129
},
{
"x": 664.2575645010472,
"y": 2543.2997562901205
},
{
"x": 673.2775143076676,
"y": 2532.3405182946344
},
{
"x": 660.9526221645935,
"y": 2390.847452284772
},
{
"x": 642.672231644635,
"y": 2495.7966193890697
},
{
"x": 644.8674786170219,
"y": 2470.4113016345873
},
{
"x": 677.956140226665,
"y": 2574.7065897855014
},
{
"x": 684.4998723681779,
"y": 2560.5080657136805
},
{
"x": 688.3867189532857,
"y": 2456.7285858472396
},
{
"x": 678.5995817071093,
"y": 2389.453376500964
},
{
"x": 638.9239546431448,
"y": 2435.515851995118
},
{
"x": 657.1325931222015,
"y": 2443.396664478071
},
{
"x": 671.8557031152775,
"y": 2413.868648155933
},
{
"x": 674.7875936927632,
"y": 2139.832439824063
},
{
"x": 661.3517994614175,
"y": 2334.6590879950204
},
{
"x": 631.2781845580912,
"y": 1975.8880710030958
},
{
"x": 665.6962580933259,
"y": 2401.4153354168175
},
{
"x": 625.2441279143142,
"y": 2123.774211134707
},
{
"x": 644.7352579721273,
"y": 2356.7946227274474
},
{
"x": 610.2539046932643,
"y": 2110.7375249294673
},
{
"x": 964.5794921346028,
"y": 3619.8281285508947
},
{
"x": 856.484458385921,
"y": 3242.070546391911
},
{
"x": 974.4596189814747,
"y": 3636.751897818985
},
{
"x": 873.7920171987819,
"y": 3117.663103096588
},
{
"x": 976.244977174782,
"y": 3618.029156149606
},
{
"x": 927.8015294828974,
"y": 3473.297985455378
},
{
"x": 978.4480951824252,
"y": 3622.8740524140667
},
{
"x": 941.8467674626263,
"y": 3460.0491760036957
},
{
"x": 962.4661216440358,
"y": 3655.0702150036896
},
{
"x": 944.3392126288243,
"y": 3475.747752800731
},
{
"x": 979.9520271917493,
"y": 3681.5096919991165
},
{
"x": 961.6727774860528,
"y": 3567.6078753386228
},
{
"x": 981.9700217898885,
"y": 3717.0994486405216
},
{
"x": 956.7401684364261,
"y": 3549.3737620301713
},
{
"x": 981.4198913555208,
"y": 3662.9750275801152
},
{
"x": 947.2734827846654,
"y": 3578.6491634160366
},
{
"x": 978.1991698559289,
"y": 3658.172684868209
},
{
"x": 965.44433929244,
"y": 3515.080464752237
},
{
"x": 979.5189166232723,
"y": 3685.3574927187824
},
{
"x": 932.8829805396341,
"y": 3471.6042169554767
}
]
}
],
"drilldown": {},
"tooltip": {
"enabled": true,
"useHTML": false,
"format": null,
"headerFormat": "",
"pointFormat": "<span style=\"color:{series.color}\">Single</span>: <b>{point.x:.0f}</b><br><span style=\"color:{series.color}\">Multi</span>: <b>{point.y:.0f}</b>",
"footerFormat": "",
"shared": false,
"outside": false,
"valueDecimals": null,
"split": false
},
"annotations": null
},
"hc_type": "chart",
"id": "91761438643067044355449506795785005407"
}
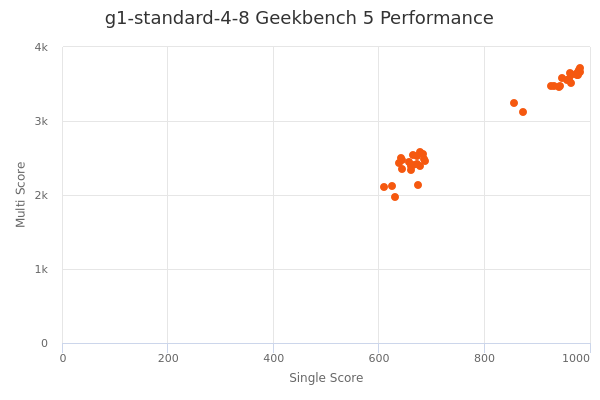
| Single | Multi | |
|---|---|---|
| Max | 982 | 3717 |
| Average | 806 | 2966 |
| Deviation | 149.74 | 604.41 |
| Min | 610 | 1976 |
Sign up as Freemium to get more insight.