x2iedn.8xlarge by Amazon Web Services
Geekbench is a cross-platform processor benchmark with a scoring system that determines single-core and multi-core performance using loads simulating real-world scenarios. Geekbench 5 score is calculated with a reference score of 2500 representing the performance of the Intel Core i5-2520M @ 2.50 GHz. The software benchmark is available for Mac OS, Windows, Linux, Android and iOS platforms.
Specifications:
CPU
32
RAM
1024.0 GB
Extra
1x
950 GB
NVMe SSD
Net
25000 Mbps
{
"configuration": {
"chart": {
"type": "scatter",
"polar": false,
"zoomType": "",
"options3d": {},
"height": null,
"width": null,
"margin": null,
"inverted": false,
"zooming": {}
},
"credits": {
"enabled": false
},
"title": {
"text": ""
},
"colorAxis": null,
"subtitle": {
"text": ""
},
"xAxis": {
"title": {
"text": [
"Single Score"
],
"useHTML": false,
"style": {
"color": "#666666"
}
},
"categories": null,
"lineWidth": 1,
"tickInterval": null,
"tickWidth": 1,
"tickLength": 10,
"tickPixelInterval": 100,
"plotLines": null,
"labels": {
"enabled": true,
"format": null,
"formatter": "",
"style": {
"color": "#666666",
"cursor": "default",
"fontSize": "11px"
},
"useHTML": false,
"step": 0
},
"plotBands": null,
"visible": true,
"floor": null,
"ceiling": null,
"type": "linear",
"min": 0,
"gridLineWidth": 1,
"gridLineColor": "#e6e6e6",
"minorTickInterval": null,
"minorTickWidth": 0,
"minTickInterval": null,
"startOnTick": true,
"endOnTick": true,
"tickmarkPlacement": 100,
"units": 100,
"minRange": 100
},
"yAxis": {
"title": {
"text": [
"Multi Score"
],
"useHTML": false,
"style": {
"color": "#666666"
}
},
"categories": null,
"plotLines": null,
"plotBands": null,
"lineWidth": null,
"tickInterval": null,
"tickLength": 10,
"floor": null,
"ceiling": null,
"gridLineInterpolation": null,
"gridLineWidth": 1,
"gridLineColor": "#e6e6e6",
"min": 0,
"max": null,
"minorTickInterval": null,
"minorTickWidth": 0,
"minTickInterval": null,
"startOnTick": true,
"endOnTick": true,
"minRange": null,
"type": "linear",
"tickmarkPlacement": null,
"labels": {
"enabled": true,
"formatter": null,
"style": {
"color": "#666666",
"cursor": "default",
"fontSize": "11px"
},
"useHTML": false
}
},
"zAxis": {
"title": {
"text": "Multi Score"
}
},
"plotOptions": {
"series": {
"dataLabels": {
"enabled": false,
"format": null,
"distance": 30,
"align": "center",
"inside": null,
"allowOverlap": false,
"style": {
"fontSize": "11px"
}
},
"showInLegend": null,
"turboThreshold": 0,
"stacking": "",
"groupPadding": 0.2,
"centerInCategory": false,
"findNearestPointBy": "x"
}
},
"navigator": {
"enabled": false
},
"scrollbar": {
"enabled": false
},
"rangeSelector": {
"enabled": false,
"inputEnabled": false
},
"legend": {
"enabled": null,
"maxHeight": null,
"align": "center",
"verticalAlign": "bottom",
"layout": "horizontal",
"width": null,
"margin": 12,
"reversed": false
},
"series": [
{
"name": "x2iedn.8xlarge by Amazon Web Services",
"color": "#f7981d",
"data": [
{
"x": 1256.2904060387389,
"y": 18182.392843723734
},
{
"x": 1208.3684013595862,
"y": 17837.264887790116
},
{
"x": 1252.8466710147272,
"y": 18220.326401046852
},
{
"x": 1200.432316693311,
"y": 17883.04341289305
},
{
"x": 1257.1623897376348,
"y": 18202.546316203196
},
{
"x": 1187.9781675349218,
"y": 17960.587401919616
},
{
"x": 1253.6817061424863,
"y": 18168.738960475057
},
{
"x": 1193.7550865648166,
"y": 17918.094223433476
},
{
"x": 1257.7152030262193,
"y": 18260.50932004757
},
{
"x": 1195.2529719030645,
"y": 18060.425961392913
},
{
"x": 1253.9820268252095,
"y": 18194.27617737351
},
{
"x": 1203.1260711935533,
"y": 17983.71415555934
},
{
"x": 1255.9837079115086,
"y": 18181.37828086349
},
{
"x": 1213.8225435889108,
"y": 17941.84423916915
},
{
"x": 1251.8789478509707,
"y": 18231.530803405312
},
{
"x": 1180.0130244205263,
"y": 18045.329357594055
},
{
"x": 1261.292881880658,
"y": 18165.106245256862
},
{
"x": 1200.1615866634831,
"y": 17914.265284868525
},
{
"x": 1252.7901984328662,
"y": 18243.13707627557
},
{
"x": 1191.7862474456447,
"y": 17912.043817713387
},
{
"x": 1230.86576930929,
"y": 16655.594755591068
},
{
"x": 1224.1787896427738,
"y": 16792.72283725389
},
{
"x": 1235.6207162408118,
"y": 16506.178126347964
},
{
"x": 1227.9282452964746,
"y": 16743.424428937145
},
{
"x": 1228.4328870081715,
"y": 16730.188016650034
},
{
"x": 1231.0760370418939,
"y": 16548.005390185288
},
{
"x": 1231.9588392824996,
"y": 16546.151070601016
},
{
"x": 1233.3484284582132,
"y": 16597.833927161704
},
{
"x": 1243.7541579899496,
"y": 17512.625798090463
},
{
"x": 1244.5389547807595,
"y": 17490.426504143074
},
{
"x": 1242.4636328135296,
"y": 17373.651657005255
},
{
"x": 1252.8582292194635,
"y": 17516.286583879388
},
{
"x": 1247.1876581416195,
"y": 17496.973462099817
},
{
"x": 1253.8294199315535,
"y": 17501.22681019625
},
{
"x": 1251.4281309109526,
"y": 17580.04759386513
},
{
"x": 1253.7275385773646,
"y": 17499.67591870515
},
{
"x": 1244.2205485269553,
"y": 17380.912683121256
},
{
"x": 1254.608640060504,
"y": 17542.166504918358
},
{
"x": 1247.09798899432,
"y": 17104.683498550217
},
{
"x": 1256.0222372980206,
"y": 17465.636324385145
}
]
}
],
"drilldown": {},
"tooltip": {
"enabled": true,
"useHTML": false,
"format": null,
"headerFormat": "",
"pointFormat": "<span style=\"color:{series.color}\">Single</span>: <b>{point.x:.0f}</b><br><span style=\"color:{series.color}\">Multi</span>: <b>{point.y:.0f}</b>",
"footerFormat": "",
"shared": false,
"outside": false,
"valueDecimals": null,
"split": false
},
"annotations": null
},
"hc_type": "chart",
"id": "177883198707334322645404526833120223621"
}
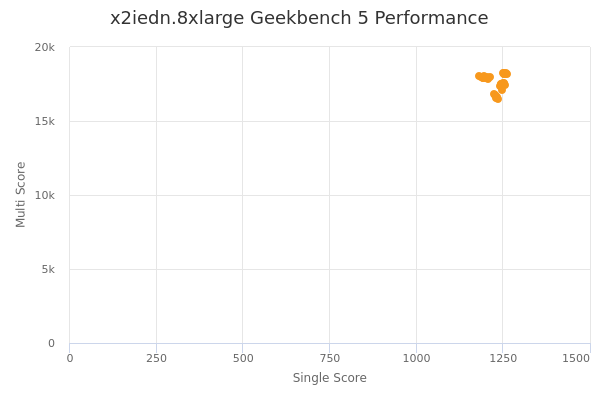
| Single | Multi | |
|---|---|---|
| Max | 1261 | 18261 |
| Average | 1234 | 17602 |
| Deviation | 23.52 | 565.31 |
| Min | 1180 | 16506 |
Sign up as Freemium to get more insight.