x2iedn.xlarge by Amazon Web Services
Geekbench is a cross-platform processor benchmark with a scoring system that determines single-core and multi-core performance using loads simulating real-world scenarios. Geekbench 5 score is calculated with a reference score of 2500 representing the performance of the Intel Core i5-2520M @ 2.50 GHz. The software benchmark is available for Mac OS, Windows, Linux, Android and iOS platforms.
Specifications:
CPU
4
RAM
128.0 GB
Extra
1x
118 GB
NVMe SSD
Net
25000 Mbps
{
"configuration": {
"chart": {
"type": "scatter",
"polar": false,
"zoomType": "",
"options3d": {},
"height": null,
"width": null,
"margin": null,
"inverted": false,
"zooming": {}
},
"credits": {
"enabled": false
},
"title": {
"text": ""
},
"colorAxis": null,
"subtitle": {
"text": ""
},
"xAxis": {
"title": {
"text": [
"Single Score"
],
"useHTML": false,
"style": {
"color": "#666666"
}
},
"categories": null,
"lineWidth": 1,
"tickInterval": null,
"tickWidth": 1,
"tickLength": 10,
"tickPixelInterval": 100,
"plotLines": null,
"labels": {
"enabled": true,
"format": null,
"formatter": "",
"style": {
"color": "#666666",
"cursor": "default",
"fontSize": "11px"
},
"useHTML": false,
"step": 0
},
"plotBands": null,
"visible": true,
"floor": null,
"ceiling": null,
"type": "linear",
"min": 0,
"gridLineWidth": 1,
"gridLineColor": "#e6e6e6",
"minorTickInterval": null,
"minorTickWidth": 0,
"minTickInterval": null,
"startOnTick": true,
"endOnTick": true,
"tickmarkPlacement": 100,
"units": 100,
"minRange": 100
},
"yAxis": {
"title": {
"text": [
"Multi Score"
],
"useHTML": false,
"style": {
"color": "#666666"
}
},
"categories": null,
"plotLines": null,
"plotBands": null,
"lineWidth": null,
"tickInterval": null,
"tickLength": 10,
"floor": null,
"ceiling": null,
"gridLineInterpolation": null,
"gridLineWidth": 1,
"gridLineColor": "#e6e6e6",
"min": 0,
"max": null,
"minorTickInterval": null,
"minorTickWidth": 0,
"minTickInterval": null,
"startOnTick": true,
"endOnTick": true,
"minRange": null,
"type": "linear",
"tickmarkPlacement": null,
"labels": {
"enabled": true,
"formatter": null,
"style": {
"color": "#666666",
"cursor": "default",
"fontSize": "11px"
},
"useHTML": false
}
},
"zAxis": {
"title": {
"text": "Multi Score"
}
},
"plotOptions": {
"series": {
"dataLabels": {
"enabled": false,
"format": null,
"distance": 30,
"align": "center",
"inside": null,
"allowOverlap": false,
"style": {
"fontSize": "11px"
}
},
"showInLegend": null,
"turboThreshold": 0,
"stacking": "",
"groupPadding": 0.2,
"centerInCategory": false,
"findNearestPointBy": "x"
}
},
"navigator": {
"enabled": false
},
"scrollbar": {
"enabled": false
},
"rangeSelector": {
"enabled": false,
"inputEnabled": false
},
"legend": {
"enabled": null,
"maxHeight": null,
"align": "center",
"verticalAlign": "bottom",
"layout": "horizontal",
"width": null,
"margin": 12,
"reversed": false
},
"series": [
{
"name": "x2iedn.xlarge by Amazon Web Services",
"color": "#f7981d",
"data": [
{
"x": 1258.3257511558475,
"y": 2841.561170618063
},
{
"x": 1254.123067511429,
"y": 2841.1731781121757
},
{
"x": 1257.4334777370218,
"y": 2832.441973342173
},
{
"x": 1254.9550548559912,
"y": 2839.3405818830224
},
{
"x": 1249.5057730284807,
"y": 2847.0811196387267
},
{
"x": 1255.9783245801573,
"y": 2839.576063525833
},
{
"x": 1259.279506144654,
"y": 2844.152925078566
},
{
"x": 1248.7839335920185,
"y": 2853.29950490957
},
{
"x": 1255.8828403845173,
"y": 2809.8678946707655
},
{
"x": 1257.4257720293372,
"y": 2829.9213951479783
},
{
"x": 1259.2999201943162,
"y": 2847.1529713682776
},
{
"x": 1254.273210129458,
"y": 2844.608890556776
},
{
"x": 1252.192882097757,
"y": 2844.601214095444
},
{
"x": 1240.5042784671873,
"y": 2844.590008616204
},
{
"x": 1254.526571596623,
"y": 2844.321476573089
},
{
"x": 1254.8853842243436,
"y": 2848.1763812542176
},
{
"x": 1250.6267935770989,
"y": 2825.794535184755
},
{
"x": 1253.6760747684577,
"y": 2842.590021562429
},
{
"x": 1254.0908575032483,
"y": 2835.4782825919538
},
{
"x": 1254.6733155750226,
"y": 2819.510770183224
}
]
}
],
"drilldown": {},
"tooltip": {
"enabled": true,
"useHTML": false,
"format": null,
"headerFormat": "",
"pointFormat": "<span style=\"color:{series.color}\">Single</span>: <b>{point.x:.0f}</b><br><span style=\"color:{series.color}\">Multi</span>: <b>{point.y:.0f}</b>",
"footerFormat": "",
"shared": false,
"outside": false,
"valueDecimals": null,
"split": false
},
"annotations": null
},
"hc_type": "chart",
"id": "41888806135155720504511233709130478277"
}
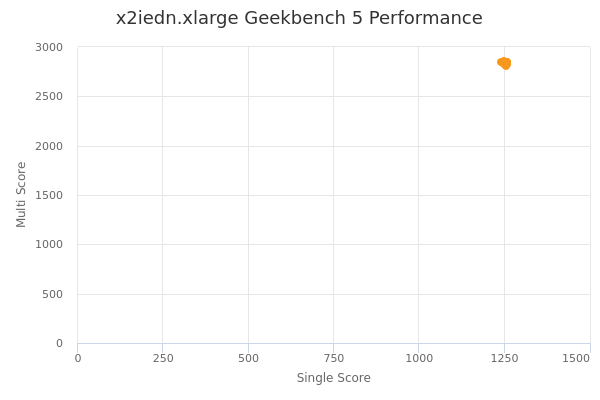
| Single | Multi | |
|---|---|---|
| Max | 1259 | 2853 |
| Average | 1254 | 2839 |
| Deviation | 4.20 | 10.33 |
| Min | 1241 | 2810 |
Sign up as Freemium to get more insight.