r6i.large by Amazon Web Services
Geekbench is a cross-platform processor benchmark with a scoring system that determines single-core and multi-core performance using loads simulating real-world scenarios. Geekbench 5 score is calculated with a reference score of 2500 representing the performance of the Intel Core i5-2520M @ 2.50 GHz. The software benchmark is available for Mac OS, Windows, Linux, Android and iOS platforms.
Specifications:
CPU
2
RAM
16.0 GB
Net
12500 Mbps
{
"configuration": {
"chart": {
"type": "scatter",
"polar": false,
"zoomType": "",
"options3d": {},
"height": null,
"width": null,
"margin": null,
"inverted": false,
"zooming": {}
},
"credits": {
"enabled": false
},
"title": {
"text": ""
},
"colorAxis": null,
"subtitle": {
"text": ""
},
"xAxis": {
"title": {
"text": [
"Single Score"
],
"useHTML": false,
"style": {
"color": "#666666"
}
},
"categories": null,
"lineWidth": 1,
"tickInterval": null,
"tickWidth": 1,
"tickLength": 10,
"tickPixelInterval": 100,
"plotLines": null,
"labels": {
"enabled": true,
"format": null,
"formatter": "",
"style": {
"color": "#666666",
"cursor": "default",
"fontSize": "11px"
},
"useHTML": false,
"step": 0
},
"plotBands": null,
"visible": true,
"floor": null,
"ceiling": null,
"type": "linear",
"min": 0,
"gridLineWidth": 1,
"gridLineColor": "#e6e6e6",
"minorTickInterval": null,
"minorTickWidth": 0,
"minTickInterval": null,
"startOnTick": true,
"endOnTick": true,
"tickmarkPlacement": 100,
"units": 100,
"minRange": 100
},
"yAxis": {
"title": {
"text": [
"Multi Score"
],
"useHTML": false,
"style": {
"color": "#666666"
}
},
"categories": null,
"plotLines": null,
"plotBands": null,
"lineWidth": null,
"tickInterval": null,
"tickLength": 10,
"floor": null,
"ceiling": null,
"gridLineInterpolation": null,
"gridLineWidth": 1,
"gridLineColor": "#e6e6e6",
"min": 0,
"max": null,
"minorTickInterval": null,
"minorTickWidth": 0,
"minTickInterval": null,
"startOnTick": true,
"endOnTick": true,
"minRange": null,
"type": "linear",
"tickmarkPlacement": null,
"labels": {
"enabled": true,
"formatter": null,
"style": {
"color": "#666666",
"cursor": "default",
"fontSize": "11px"
},
"useHTML": false
}
},
"zAxis": {
"title": {
"text": "Multi Score"
}
},
"plotOptions": {
"series": {
"dataLabels": {
"enabled": false,
"format": null,
"distance": 30,
"align": "center",
"inside": null,
"allowOverlap": false,
"style": {
"fontSize": "11px"
}
},
"showInLegend": null,
"turboThreshold": 0,
"stacking": "",
"groupPadding": 0.2,
"centerInCategory": false,
"findNearestPointBy": "x"
}
},
"navigator": {
"enabled": false
},
"scrollbar": {
"enabled": false
},
"rangeSelector": {
"enabled": false,
"inputEnabled": false
},
"legend": {
"enabled": null,
"maxHeight": null,
"align": "center",
"verticalAlign": "bottom",
"layout": "horizontal",
"width": null,
"margin": 12,
"reversed": false
},
"series": [
{
"name": "r6i.large by Amazon Web Services",
"color": "#f7981d",
"data": [
{
"x": 1184.5081522268204,
"y": 1402.7052817256554
},
{
"x": 1131.2552038838712,
"y": 1366.2159128236194
},
{
"x": 1186.719528429115,
"y": 1395.4019833285213
},
{
"x": 1149.4108075783001,
"y": 1363.3592793076177
},
{
"x": 1188.4627613399152,
"y": 1400.5251178592648
},
{
"x": 1140.2089587069745,
"y": 1349.494170690718
},
{
"x": 1194.6784813860806,
"y": 1397.3896056582073
},
{
"x": 1145.09924737275,
"y": 1359.6015091795098
},
{
"x": 1200.6316512754488,
"y": 1400.674734410367
},
{
"x": 1160.5957941592776,
"y": 1350.971841850655
},
{
"x": 1198.2999810747635,
"y": 1396.293557558815
},
{
"x": 1145.3416755920598,
"y": 1340.3665630881944
},
{
"x": 1197.0646334536243,
"y": 1392.7744353723049
},
{
"x": 1141.8539008529158,
"y": 1363.0081238661232
},
{
"x": 1191.5793694959223,
"y": 1387.2625322240624
},
{
"x": 1152.7693394932412,
"y": 1353.0970698592473
},
{
"x": 1184.663968583505,
"y": 1392.2721035537852
},
{
"x": 1144.521515572436,
"y": 1366.9861961934726
},
{
"x": 1187.127024146193,
"y": 1394.136300159906
},
{
"x": 1151.2627547456386,
"y": 1371.788249396567
}
]
}
],
"drilldown": {},
"tooltip": {
"enabled": true,
"useHTML": false,
"format": null,
"headerFormat": "",
"pointFormat": "<span style=\"color:{series.color}\">Single</span>: <b>{point.x:.0f}</b><br><span style=\"color:{series.color}\">Multi</span>: <b>{point.y:.0f}</b>",
"footerFormat": "",
"shared": false,
"outside": false,
"valueDecimals": null,
"split": false
},
"annotations": null
},
"hc_type": "chart",
"id": "19890624558312199022368705804431035287"
}
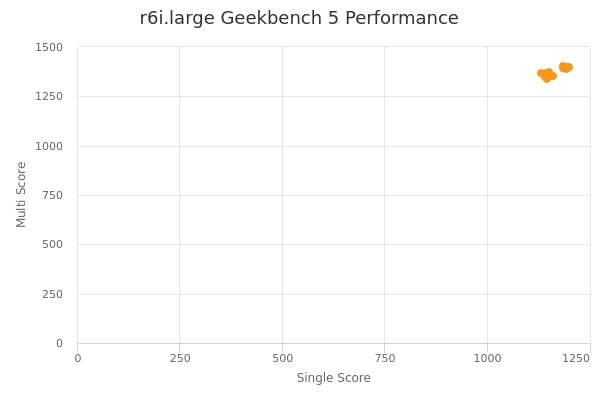
| Single | Multi | |
|---|---|---|
| Max | 1201 | 1403 |
| Average | 1169 | 1377 |
| Deviation | 23.53 | 20.07 |
| Min | 1131 | 1340 |
Sign up as Freemium to get more insight.