r6i.8xlarge by Amazon Web Services
Geekbench is a cross-platform processor benchmark with a scoring system that determines single-core and multi-core performance using loads simulating real-world scenarios. Geekbench 5 score is calculated with a reference score of 2500 representing the performance of the Intel Core i5-2520M @ 2.50 GHz. The software benchmark is available for Mac OS, Windows, Linux, Android and iOS platforms.
Specifications:
CPU
32
RAM
256.0 GB
Net
12500 Mbps
{
"configuration": {
"chart": {
"type": "scatter",
"polar": false,
"zoomType": "",
"options3d": {},
"height": null,
"width": null,
"margin": null,
"inverted": false,
"zooming": {}
},
"credits": {
"enabled": false
},
"title": {
"text": ""
},
"colorAxis": null,
"subtitle": {
"text": ""
},
"xAxis": {
"title": {
"text": [
"Single Score"
],
"useHTML": false,
"style": {
"color": "#666666"
}
},
"categories": null,
"lineWidth": 1,
"tickInterval": null,
"tickWidth": 1,
"tickLength": 10,
"tickPixelInterval": 100,
"plotLines": null,
"labels": {
"enabled": true,
"format": null,
"formatter": "",
"style": {
"color": "#666666",
"cursor": "default",
"fontSize": "11px"
},
"useHTML": false,
"step": 0
},
"plotBands": null,
"visible": true,
"floor": null,
"ceiling": null,
"type": "linear",
"min": 0,
"gridLineWidth": 1,
"gridLineColor": "#e6e6e6",
"minorTickInterval": null,
"minorTickWidth": 0,
"minTickInterval": null,
"startOnTick": true,
"endOnTick": true,
"tickmarkPlacement": 100,
"units": 100,
"minRange": 100
},
"yAxis": {
"title": {
"text": [
"Multi Score"
],
"useHTML": false,
"style": {
"color": "#666666"
}
},
"categories": null,
"plotLines": null,
"plotBands": null,
"lineWidth": null,
"tickInterval": null,
"tickLength": 10,
"floor": null,
"ceiling": null,
"gridLineInterpolation": null,
"gridLineWidth": 1,
"gridLineColor": "#e6e6e6",
"min": 0,
"max": null,
"minorTickInterval": null,
"minorTickWidth": 0,
"minTickInterval": null,
"startOnTick": true,
"endOnTick": true,
"minRange": null,
"type": "linear",
"tickmarkPlacement": null,
"labels": {
"enabled": true,
"formatter": null,
"style": {
"color": "#666666",
"cursor": "default",
"fontSize": "11px"
},
"useHTML": false
}
},
"zAxis": {
"title": {
"text": "Multi Score"
}
},
"plotOptions": {
"series": {
"dataLabels": {
"enabled": false,
"format": null,
"distance": 30,
"align": "center",
"inside": null,
"allowOverlap": false,
"style": {
"fontSize": "11px"
}
},
"showInLegend": null,
"turboThreshold": 0,
"stacking": "",
"groupPadding": 0.2,
"centerInCategory": false,
"findNearestPointBy": "x"
}
},
"navigator": {
"enabled": false
},
"scrollbar": {
"enabled": false
},
"rangeSelector": {
"enabled": false,
"inputEnabled": false
},
"legend": {
"enabled": null,
"maxHeight": null,
"align": "center",
"verticalAlign": "bottom",
"layout": "horizontal",
"width": null,
"margin": 12,
"reversed": false
},
"series": [
{
"name": "r6i.8xlarge by Amazon Web Services",
"color": "#f7981d",
"data": [
{
"x": 1264.6979126854728,
"y": 18418.82832521301
},
{
"x": 1239.0071116585825,
"y": 18404.75527579833
},
{
"x": 1262.368447516635,
"y": 18475.882504865018
},
{
"x": 1243.59099300867,
"y": 18273.359168208808
},
{
"x": 1266.5890301369886,
"y": 18411.81935139707
},
{
"x": 1248.9821961519642,
"y": 18382.56812398323
},
{
"x": 1264.9756620598241,
"y": 18397.3633762135
},
{
"x": 1246.6884147611263,
"y": 18413.07868916469
},
{
"x": 1252.5790612964806,
"y": 18277.853482736493
},
{
"x": 1246.7555611234075,
"y": 18310.271398574485
},
{
"x": 1265.1224429617205,
"y": 18408.425928425175
},
{
"x": 1247.7570891850198,
"y": 18325.294338915075
},
{
"x": 1263.3964000996602,
"y": 18356.735802303396
},
{
"x": 1244.4729141045436,
"y": 18442.796147250705
},
{
"x": 1265.816002126267,
"y": 18432.873195278404
},
{
"x": 1239.1776128031117,
"y": 18250.387988755963
},
{
"x": 1264.6569272112572,
"y": 18383.28248154938
},
{
"x": 1238.6951997990489,
"y": 18377.618930146775
},
{
"x": 1265.3243233512717,
"y": 18432.430393781346
},
{
"x": 1248.1171512050971,
"y": 18388.093606894614
}
]
}
],
"drilldown": {},
"tooltip": {
"enabled": true,
"useHTML": false,
"format": null,
"headerFormat": "",
"pointFormat": "<span style=\"color:{series.color}\">Single</span>: <b>{point.x:.0f}</b><br><span style=\"color:{series.color}\">Multi</span>: <b>{point.y:.0f}</b>",
"footerFormat": "",
"shared": false,
"outside": false,
"valueDecimals": null,
"split": false
},
"annotations": null
},
"hc_type": "chart",
"id": "137877500322526642646043160830850351971"
}
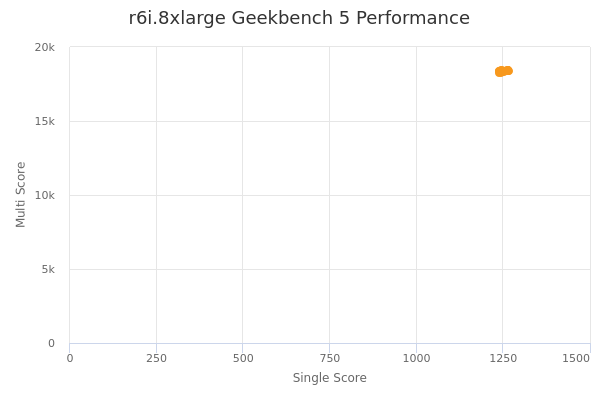
| Single | Multi | |
|---|---|---|
| Max | 1267 | 18476 |
| Average | 1254 | 18378 |
| Deviation | 10.35 | 59.60 |
| Min | 1239 | 18250 |
Sign up as Freemium to get more insight.