r6i.4xlarge by Amazon Web Services
Geekbench is a cross-platform processor benchmark with a scoring system that determines single-core and multi-core performance using loads simulating real-world scenarios. Geekbench 5 score is calculated with a reference score of 2500 representing the performance of the Intel Core i5-2520M @ 2.50 GHz. The software benchmark is available for Mac OS, Windows, Linux, Android and iOS platforms.
Specifications:
CPU
16
RAM
128.0 GB
Net
12500 Mbps
{
"configuration": {
"chart": {
"type": "scatter",
"polar": false,
"zoomType": "",
"options3d": {},
"height": null,
"width": null,
"margin": null,
"inverted": false,
"zooming": {}
},
"credits": {
"enabled": false
},
"title": {
"text": ""
},
"colorAxis": null,
"subtitle": {
"text": ""
},
"xAxis": {
"title": {
"text": [
"Single Score"
],
"useHTML": false,
"style": {
"color": "#666666"
}
},
"categories": null,
"lineWidth": 1,
"tickInterval": null,
"tickWidth": 1,
"tickLength": 10,
"tickPixelInterval": 100,
"plotLines": null,
"labels": {
"enabled": true,
"format": null,
"formatter": "",
"style": {
"color": "#666666",
"cursor": "default",
"fontSize": "11px"
},
"useHTML": false,
"step": 0
},
"plotBands": null,
"visible": true,
"floor": null,
"ceiling": null,
"type": "linear",
"min": 0,
"gridLineWidth": 1,
"gridLineColor": "#e6e6e6",
"minorTickInterval": null,
"minorTickWidth": 0,
"minTickInterval": null,
"startOnTick": true,
"endOnTick": true,
"tickmarkPlacement": 100,
"units": 100,
"minRange": 100
},
"yAxis": {
"title": {
"text": [
"Multi Score"
],
"useHTML": false,
"style": {
"color": "#666666"
}
},
"categories": null,
"plotLines": null,
"plotBands": null,
"lineWidth": null,
"tickInterval": null,
"tickLength": 10,
"floor": null,
"ceiling": null,
"gridLineInterpolation": null,
"gridLineWidth": 1,
"gridLineColor": "#e6e6e6",
"min": 0,
"max": null,
"minorTickInterval": null,
"minorTickWidth": 0,
"minTickInterval": null,
"startOnTick": true,
"endOnTick": true,
"minRange": null,
"type": "linear",
"tickmarkPlacement": null,
"labels": {
"enabled": true,
"formatter": null,
"style": {
"color": "#666666",
"cursor": "default",
"fontSize": "11px"
},
"useHTML": false
}
},
"zAxis": {
"title": {
"text": "Multi Score"
}
},
"plotOptions": {
"series": {
"dataLabels": {
"enabled": false,
"format": null,
"distance": 30,
"align": "center",
"inside": null,
"allowOverlap": false,
"style": {
"fontSize": "11px"
}
},
"showInLegend": null,
"turboThreshold": 0,
"stacking": "",
"groupPadding": 0.2,
"centerInCategory": false,
"findNearestPointBy": "x"
}
},
"navigator": {
"enabled": false
},
"scrollbar": {
"enabled": false
},
"rangeSelector": {
"enabled": false,
"inputEnabled": false
},
"legend": {
"enabled": null,
"maxHeight": null,
"align": "center",
"verticalAlign": "bottom",
"layout": "horizontal",
"width": null,
"margin": 12,
"reversed": false
},
"series": [
{
"name": "r6i.4xlarge by Amazon Web Services",
"color": "#f7981d",
"data": [
{
"x": 1242.2216594648878,
"y": 10153.596751215428
},
{
"x": 1229.73469498632,
"y": 10106.372528131327
},
{
"x": 1258.7313074982435,
"y": 10169.014699105777
},
{
"x": 1201.7163093750823,
"y": 10166.91680375922
},
{
"x": 1253.769756442439,
"y": 10192.739107079255
},
{
"x": 1244.6022761883032,
"y": 10180.987652063262
},
{
"x": 1247.687962614365,
"y": 10115.350757622527
},
{
"x": 1241.0128215762143,
"y": 10153.111640764497
},
{
"x": 1243.7242461656765,
"y": 10093.352040027532
},
{
"x": 1246.2810607272606,
"y": 10138.570244008291
},
{
"x": 1239.8120592271412,
"y": 10117.50941441678
},
{
"x": 1230.7012637098774,
"y": 10112.04726606149
},
{
"x": 1232.3328032174347,
"y": 10130.520642791847
},
{
"x": 1228.5695037380544,
"y": 10159.2289053057
},
{
"x": 1220.354166079096,
"y": 10103.858084960411
},
{
"x": 1238.0035298004625,
"y": 10136.552957142048
},
{
"x": 1234.8639237895625,
"y": 10119.859163131154
},
{
"x": 1242.3745955384518,
"y": 10112.887348838072
},
{
"x": 1240.5869549489835,
"y": 10056.888324271808
},
{
"x": 1240.5406506279753,
"y": 10126.807684786974
},
{
"x": 1277.1396968561248,
"y": 10219.431610170139
},
{
"x": 1176.1194279863055,
"y": 9789.949254540357
},
{
"x": 1273.821951312856,
"y": 10207.378501468069
},
{
"x": 1180.308940364419,
"y": 9833.150301390837
},
{
"x": 1259.0793111287546,
"y": 10175.519456285794
},
{
"x": 1157.4381280999185,
"y": 9856.982201104807
},
{
"x": 1274.996981318349,
"y": 10238.617013434885
},
{
"x": 1163.200897829392,
"y": 9796.588259469649
},
{
"x": 1262.840881519174,
"y": 10200.621940971736
},
{
"x": 1171.9670099824293,
"y": 9867.130132686449
},
{
"x": 1275.2784833153275,
"y": 10221.003661110266
},
{
"x": 1169.0300288813032,
"y": 9765.063819444465
},
{
"x": 1259.3869250433472,
"y": 10163.97080943202
},
{
"x": 1161.4720474182864,
"y": 9821.01190060395
},
{
"x": 1276.1683681220638,
"y": 10208.551712311524
},
{
"x": 1158.409699240504,
"y": 9735.454624461621
},
{
"x": 1279.117216382732,
"y": 10193.46898745827
},
{
"x": 1165.6062264300822,
"y": 9884.184589092689
},
{
"x": 1263.8366161188849,
"y": 10195.497313369378
},
{
"x": 1197.3777212593648,
"y": 9807.88290441196
}
]
}
],
"drilldown": {},
"tooltip": {
"enabled": true,
"useHTML": false,
"format": null,
"headerFormat": "",
"pointFormat": "<span style=\"color:{series.color}\">Single</span>: <b>{point.x:.0f}</b><br><span style=\"color:{series.color}\">Multi</span>: <b>{point.y:.0f}</b>",
"footerFormat": "",
"shared": false,
"outside": false,
"valueDecimals": null,
"split": false
},
"annotations": null
},
"hc_type": "chart",
"id": "58549614732597707190972908579807752611"
}
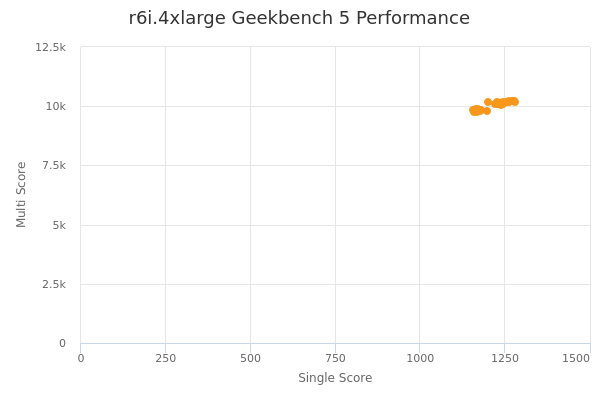
| Single | Multi | |
|---|---|---|
| Max | 1279 | 10239 |
| Average | 1229 | 10071 |
| Deviation | 38.07 | 153.59 |
| Min | 1157 | 9735 |
Sign up as Freemium to get more insight.