r5b.4xlarge by Amazon Web Services
Geekbench is a cross-platform processor benchmark with a scoring system that determines single-core and multi-core performance using loads simulating real-world scenarios. Geekbench 5 score is calculated with a reference score of 2500 representing the performance of the Intel Core i5-2520M @ 2.50 GHz. The software benchmark is available for Mac OS, Windows, Linux, Android and iOS platforms.
Specifications:
CPU
16
RAM
128.0 GB
Net
10000 Mbps
{
"configuration": {
"chart": {
"type": "scatter",
"polar": false,
"zoomType": "",
"options3d": {},
"height": null,
"width": null,
"margin": null,
"inverted": false,
"zooming": {}
},
"credits": {
"enabled": false
},
"title": {
"text": ""
},
"colorAxis": null,
"subtitle": {
"text": ""
},
"xAxis": {
"title": {
"text": [
"Single Score"
],
"useHTML": false,
"style": {
"color": "#666666"
}
},
"categories": null,
"lineWidth": 1,
"tickInterval": null,
"tickWidth": 1,
"tickLength": 10,
"tickPixelInterval": 100,
"plotLines": null,
"labels": {
"enabled": true,
"format": null,
"formatter": "",
"style": {
"color": "#666666",
"cursor": "default",
"fontSize": "11px"
},
"useHTML": false,
"step": 0
},
"plotBands": null,
"visible": true,
"floor": null,
"ceiling": null,
"type": "linear",
"min": 0,
"gridLineWidth": 1,
"gridLineColor": "#e6e6e6",
"minorTickInterval": null,
"minorTickWidth": 0,
"minTickInterval": null,
"startOnTick": true,
"endOnTick": true,
"tickmarkPlacement": 100,
"units": 100,
"minRange": 100
},
"yAxis": {
"title": {
"text": [
"Multi Score"
],
"useHTML": false,
"style": {
"color": "#666666"
}
},
"categories": null,
"plotLines": null,
"plotBands": null,
"lineWidth": null,
"tickInterval": null,
"tickLength": 10,
"floor": null,
"ceiling": null,
"gridLineInterpolation": null,
"gridLineWidth": 1,
"gridLineColor": "#e6e6e6",
"min": 0,
"max": null,
"minorTickInterval": null,
"minorTickWidth": 0,
"minTickInterval": null,
"startOnTick": true,
"endOnTick": true,
"minRange": null,
"type": "linear",
"tickmarkPlacement": null,
"labels": {
"enabled": true,
"formatter": null,
"style": {
"color": "#666666",
"cursor": "default",
"fontSize": "11px"
},
"useHTML": false
}
},
"zAxis": {
"title": {
"text": "Multi Score"
}
},
"plotOptions": {
"series": {
"dataLabels": {
"enabled": false,
"format": null,
"distance": 30,
"align": "center",
"inside": null,
"allowOverlap": false,
"style": {
"fontSize": "11px"
}
},
"showInLegend": null,
"turboThreshold": 0,
"stacking": "",
"groupPadding": 0.2,
"centerInCategory": false,
"findNearestPointBy": "x"
}
},
"navigator": {
"enabled": false
},
"scrollbar": {
"enabled": false
},
"rangeSelector": {
"enabled": false,
"inputEnabled": false
},
"legend": {
"enabled": null,
"maxHeight": null,
"align": "center",
"verticalAlign": "bottom",
"layout": "horizontal",
"width": null,
"margin": 12,
"reversed": false
},
"series": [
{
"name": "r5b.4xlarge by Amazon Web Services",
"color": "#f7981d",
"data": [
{
"x": 883.4482984801723,
"y": 7626.970352728922
},
{
"x": 881.5036462831583,
"y": 7624.016664788778
},
{
"x": 892.8880209868187,
"y": 7658.862908463338
},
{
"x": 894.9842868121074,
"y": 7685.161768508411
},
{
"x": 897.3769410756975,
"y": 7691.1967178883115
},
{
"x": 893.9461229730039,
"y": 7715.215526387978
},
{
"x": 894.648246133572,
"y": 7693.918659896424
},
{
"x": 892.9110344178116,
"y": 7731.788642082273
},
{
"x": 899.5780254530741,
"y": 7767.250588576851
},
{
"x": 895.3868802167403,
"y": 7794.489474304879
},
{
"x": 898.2746097541308,
"y": 7806.8744743377465
},
{
"x": 889.5460991828334,
"y": 7774.847165161365
},
{
"x": 898.8633528597747,
"y": 7810.120612288175
},
{
"x": 899.676946391776,
"y": 7791.267210838327
},
{
"x": 898.2187282196078,
"y": 7658.248487658041
},
{
"x": 903.179326590858,
"y": 7733.141580701995
},
{
"x": 895.8954183944658,
"y": 7634.851295358967
},
{
"x": 897.0431309624169,
"y": 7711.946569577065
},
{
"x": 885.6445420243972,
"y": 7577.449278828752
},
{
"x": 888.4270977561204,
"y": 7658.300728846716
},
{
"x": 901.3356927600616,
"y": 7794.974665243313
},
{
"x": 886.8852354456067,
"y": 7749.371806472431
},
{
"x": 898.1336954349642,
"y": 7792.387860723113
},
{
"x": 884.6999791428589,
"y": 7763.639253626332
},
{
"x": 901.7954350564626,
"y": 7806.446857440669
},
{
"x": 882.7912591008972,
"y": 7773.136182095768
},
{
"x": 898.6598926166566,
"y": 7813.824131462668
},
{
"x": 887.9449003754153,
"y": 7739.7197549551265
},
{
"x": 898.2166894450609,
"y": 7797.757115859142
},
{
"x": 883.1266318639479,
"y": 7739.672292040446
},
{
"x": 897.2727240992177,
"y": 7792.500070464423
},
{
"x": 875.179685006201,
"y": 7765.447553786416
},
{
"x": 898.0981211128386,
"y": 7837.025586300049
},
{
"x": 887.1147392558623,
"y": 7754.087595452254
},
{
"x": 897.0560822125956,
"y": 7788.7794696162355
},
{
"x": 884.074336048378,
"y": 7793.713778418018
},
{
"x": 897.9014668990408,
"y": 7799.044924977692
},
{
"x": 881.8053801448232,
"y": 7774.463829946108
},
{
"x": 897.3546892682496,
"y": 7779.335701738739
},
{
"x": 881.6228995628262,
"y": 7758.726356398835
}
]
}
],
"drilldown": {},
"tooltip": {
"enabled": true,
"useHTML": false,
"format": null,
"headerFormat": "",
"pointFormat": "<span style=\"color:{series.color}\">Single</span>: <b>{point.x:.0f}</b><br><span style=\"color:{series.color}\">Multi</span>: <b>{point.y:.0f}</b>",
"footerFormat": "",
"shared": false,
"outside": false,
"valueDecimals": null,
"split": false
},
"annotations": null
},
"hc_type": "chart",
"id": "35074262587816222743144840297096197180"
}
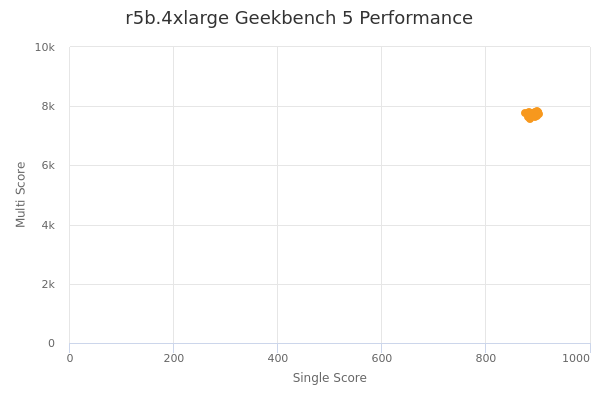
| Single | Multi | |
|---|---|---|
| Max | 903 | 7837 |
| Average | 893 | 7744 |
| Deviation | 7.07 | 62.16 |
| Min | 875 | 7577 |
Sign up as Freemium to get more insight.