r5b.8xlarge by Amazon Web Services
Geekbench is a cross-platform processor benchmark with a scoring system that determines single-core and multi-core performance using loads simulating real-world scenarios. Geekbench 5 score is calculated with a reference score of 2500 representing the performance of the Intel Core i5-2520M @ 2.50 GHz. The software benchmark is available for Mac OS, Windows, Linux, Android and iOS platforms.
Specifications:
CPU
32
RAM
256.0 GB
Net
10000 Mbps
{
"configuration": {
"chart": {
"type": "scatter",
"polar": false,
"zoomType": "",
"options3d": {},
"height": null,
"width": null,
"margin": null,
"inverted": false,
"zooming": {}
},
"credits": {
"enabled": false
},
"title": {
"text": ""
},
"colorAxis": null,
"subtitle": {
"text": ""
},
"xAxis": {
"title": {
"text": [
"Single Score"
],
"useHTML": false,
"style": {
"color": "#666666"
}
},
"categories": null,
"lineWidth": 1,
"tickInterval": null,
"tickWidth": 1,
"tickLength": 10,
"tickPixelInterval": 100,
"plotLines": null,
"labels": {
"enabled": true,
"format": null,
"formatter": "",
"style": {
"color": "#666666",
"cursor": "default",
"fontSize": "11px"
},
"useHTML": false,
"step": 0
},
"plotBands": null,
"visible": true,
"floor": null,
"ceiling": null,
"type": "linear",
"min": 0,
"gridLineWidth": 1,
"gridLineColor": "#e6e6e6",
"minorTickInterval": null,
"minorTickWidth": 0,
"minTickInterval": null,
"startOnTick": true,
"endOnTick": true,
"tickmarkPlacement": 100,
"units": 100,
"minRange": 100
},
"yAxis": {
"title": {
"text": [
"Multi Score"
],
"useHTML": false,
"style": {
"color": "#666666"
}
},
"categories": null,
"plotLines": null,
"plotBands": null,
"lineWidth": null,
"tickInterval": null,
"tickLength": 10,
"floor": null,
"ceiling": null,
"gridLineInterpolation": null,
"gridLineWidth": 1,
"gridLineColor": "#e6e6e6",
"min": 0,
"max": null,
"minorTickInterval": null,
"minorTickWidth": 0,
"minTickInterval": null,
"startOnTick": true,
"endOnTick": true,
"minRange": null,
"type": "linear",
"tickmarkPlacement": null,
"labels": {
"enabled": true,
"formatter": null,
"style": {
"color": "#666666",
"cursor": "default",
"fontSize": "11px"
},
"useHTML": false
}
},
"zAxis": {
"title": {
"text": "Multi Score"
}
},
"plotOptions": {
"series": {
"dataLabels": {
"enabled": false,
"format": null,
"distance": 30,
"align": "center",
"inside": null,
"allowOverlap": false,
"style": {
"fontSize": "11px"
}
},
"showInLegend": null,
"turboThreshold": 0,
"stacking": "",
"groupPadding": 0.2,
"centerInCategory": false,
"findNearestPointBy": "x"
}
},
"navigator": {
"enabled": false
},
"scrollbar": {
"enabled": false
},
"rangeSelector": {
"enabled": false,
"inputEnabled": false
},
"legend": {
"enabled": null,
"maxHeight": null,
"align": "center",
"verticalAlign": "bottom",
"layout": "horizontal",
"width": null,
"margin": 12,
"reversed": false
},
"series": [
{
"name": "r5b.8xlarge by Amazon Web Services",
"color": "#f7981d",
"data": [
{
"x": 916.7551083934973,
"y": 14654.206612877686
},
{
"x": 919.2454794557195,
"y": 14654.053930138536
},
{
"x": 916.7541902633834,
"y": 14717.486070192363
},
{
"x": 915.0679337718711,
"y": 14707.143139902242
},
{
"x": 917.47174016702,
"y": 14736.13064929712
},
{
"x": 916.8839605713129,
"y": 14705.46017544614
},
{
"x": 916.639718688799,
"y": 14720.605407894145
},
{
"x": 916.8711952964061,
"y": 14726.841067897418
},
{
"x": 916.9587449764904,
"y": 14756.640401160792
},
{
"x": 916.1724647642595,
"y": 14682.991489253232
},
{
"x": 916.7034250336987,
"y": 14700.255747274126
},
{
"x": 916.4138830834361,
"y": 14701.838705453963
},
{
"x": 920.6795958508014,
"y": 14720.97444326241
},
{
"x": 917.5651237030389,
"y": 14713.914473883846
},
{
"x": 916.7830684743299,
"y": 14723.670694073628
},
{
"x": 916.8331846427375,
"y": 14686.58136737504
},
{
"x": 917.137994417367,
"y": 14688.256187384042
},
{
"x": 915.7855952069488,
"y": 14684.930978258246
},
{
"x": 916.520724046832,
"y": 14680.916343777455
},
{
"x": 915.1457490495255,
"y": 14669.158745969844
}
]
}
],
"drilldown": {},
"tooltip": {
"enabled": true,
"useHTML": false,
"format": null,
"headerFormat": "",
"pointFormat": "<span style=\"color:{series.color}\">Single</span>: <b>{point.x:.0f}</b><br><span style=\"color:{series.color}\">Multi</span>: <b>{point.y:.0f}</b>",
"footerFormat": "",
"shared": false,
"outside": false,
"valueDecimals": null,
"split": false
},
"annotations": null
},
"hc_type": "chart",
"id": "206149255168840795456308669569805661714"
}
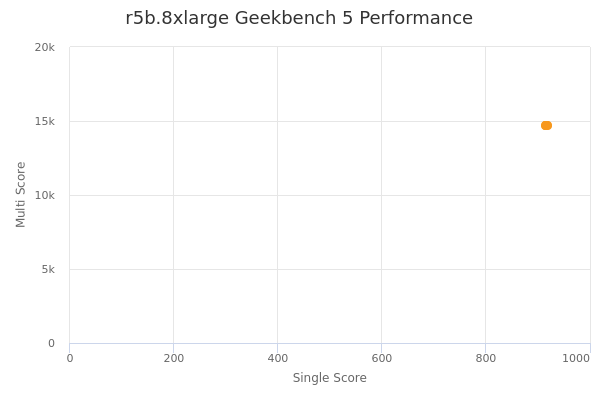
| Single | Multi | |
|---|---|---|
| Max | 921 | 14757 |
| Average | 917 | 14702 |
| Deviation | 1.21 | 26.03 |
| Min | 915 | 14654 |
Sign up as Freemium to get more insight.